
This project focused on developing an analytical suspension optimization model in MATLAB to predict optimal spring stiffness and damping ratios for an SAE Baja vehicle competing in an endurance race. The objective was to provide the Wildcat Racing team with a data-driven method to tune front and rear suspension systems for rough terrain performance.
The model incorporated simulated track profile data including peak heights, valley depths, and terrain spacing from the endurance course. This tool was designed to enable systematic suspension tuning based on quantifiable terrain characteristics rather than trial and error adjustments.
Above is a link to a detailed analysis.
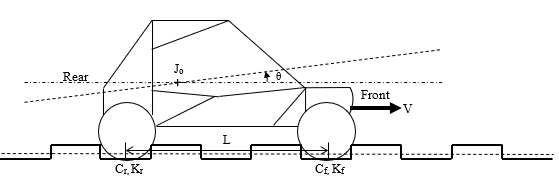
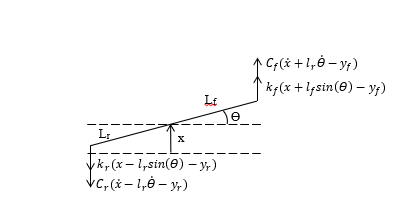
This project utilizes a general forcing function with 2 degrees of freedom to simulate the front a rear suspension of the car. Through the use of a half car model and FBD base focing function equations are created.
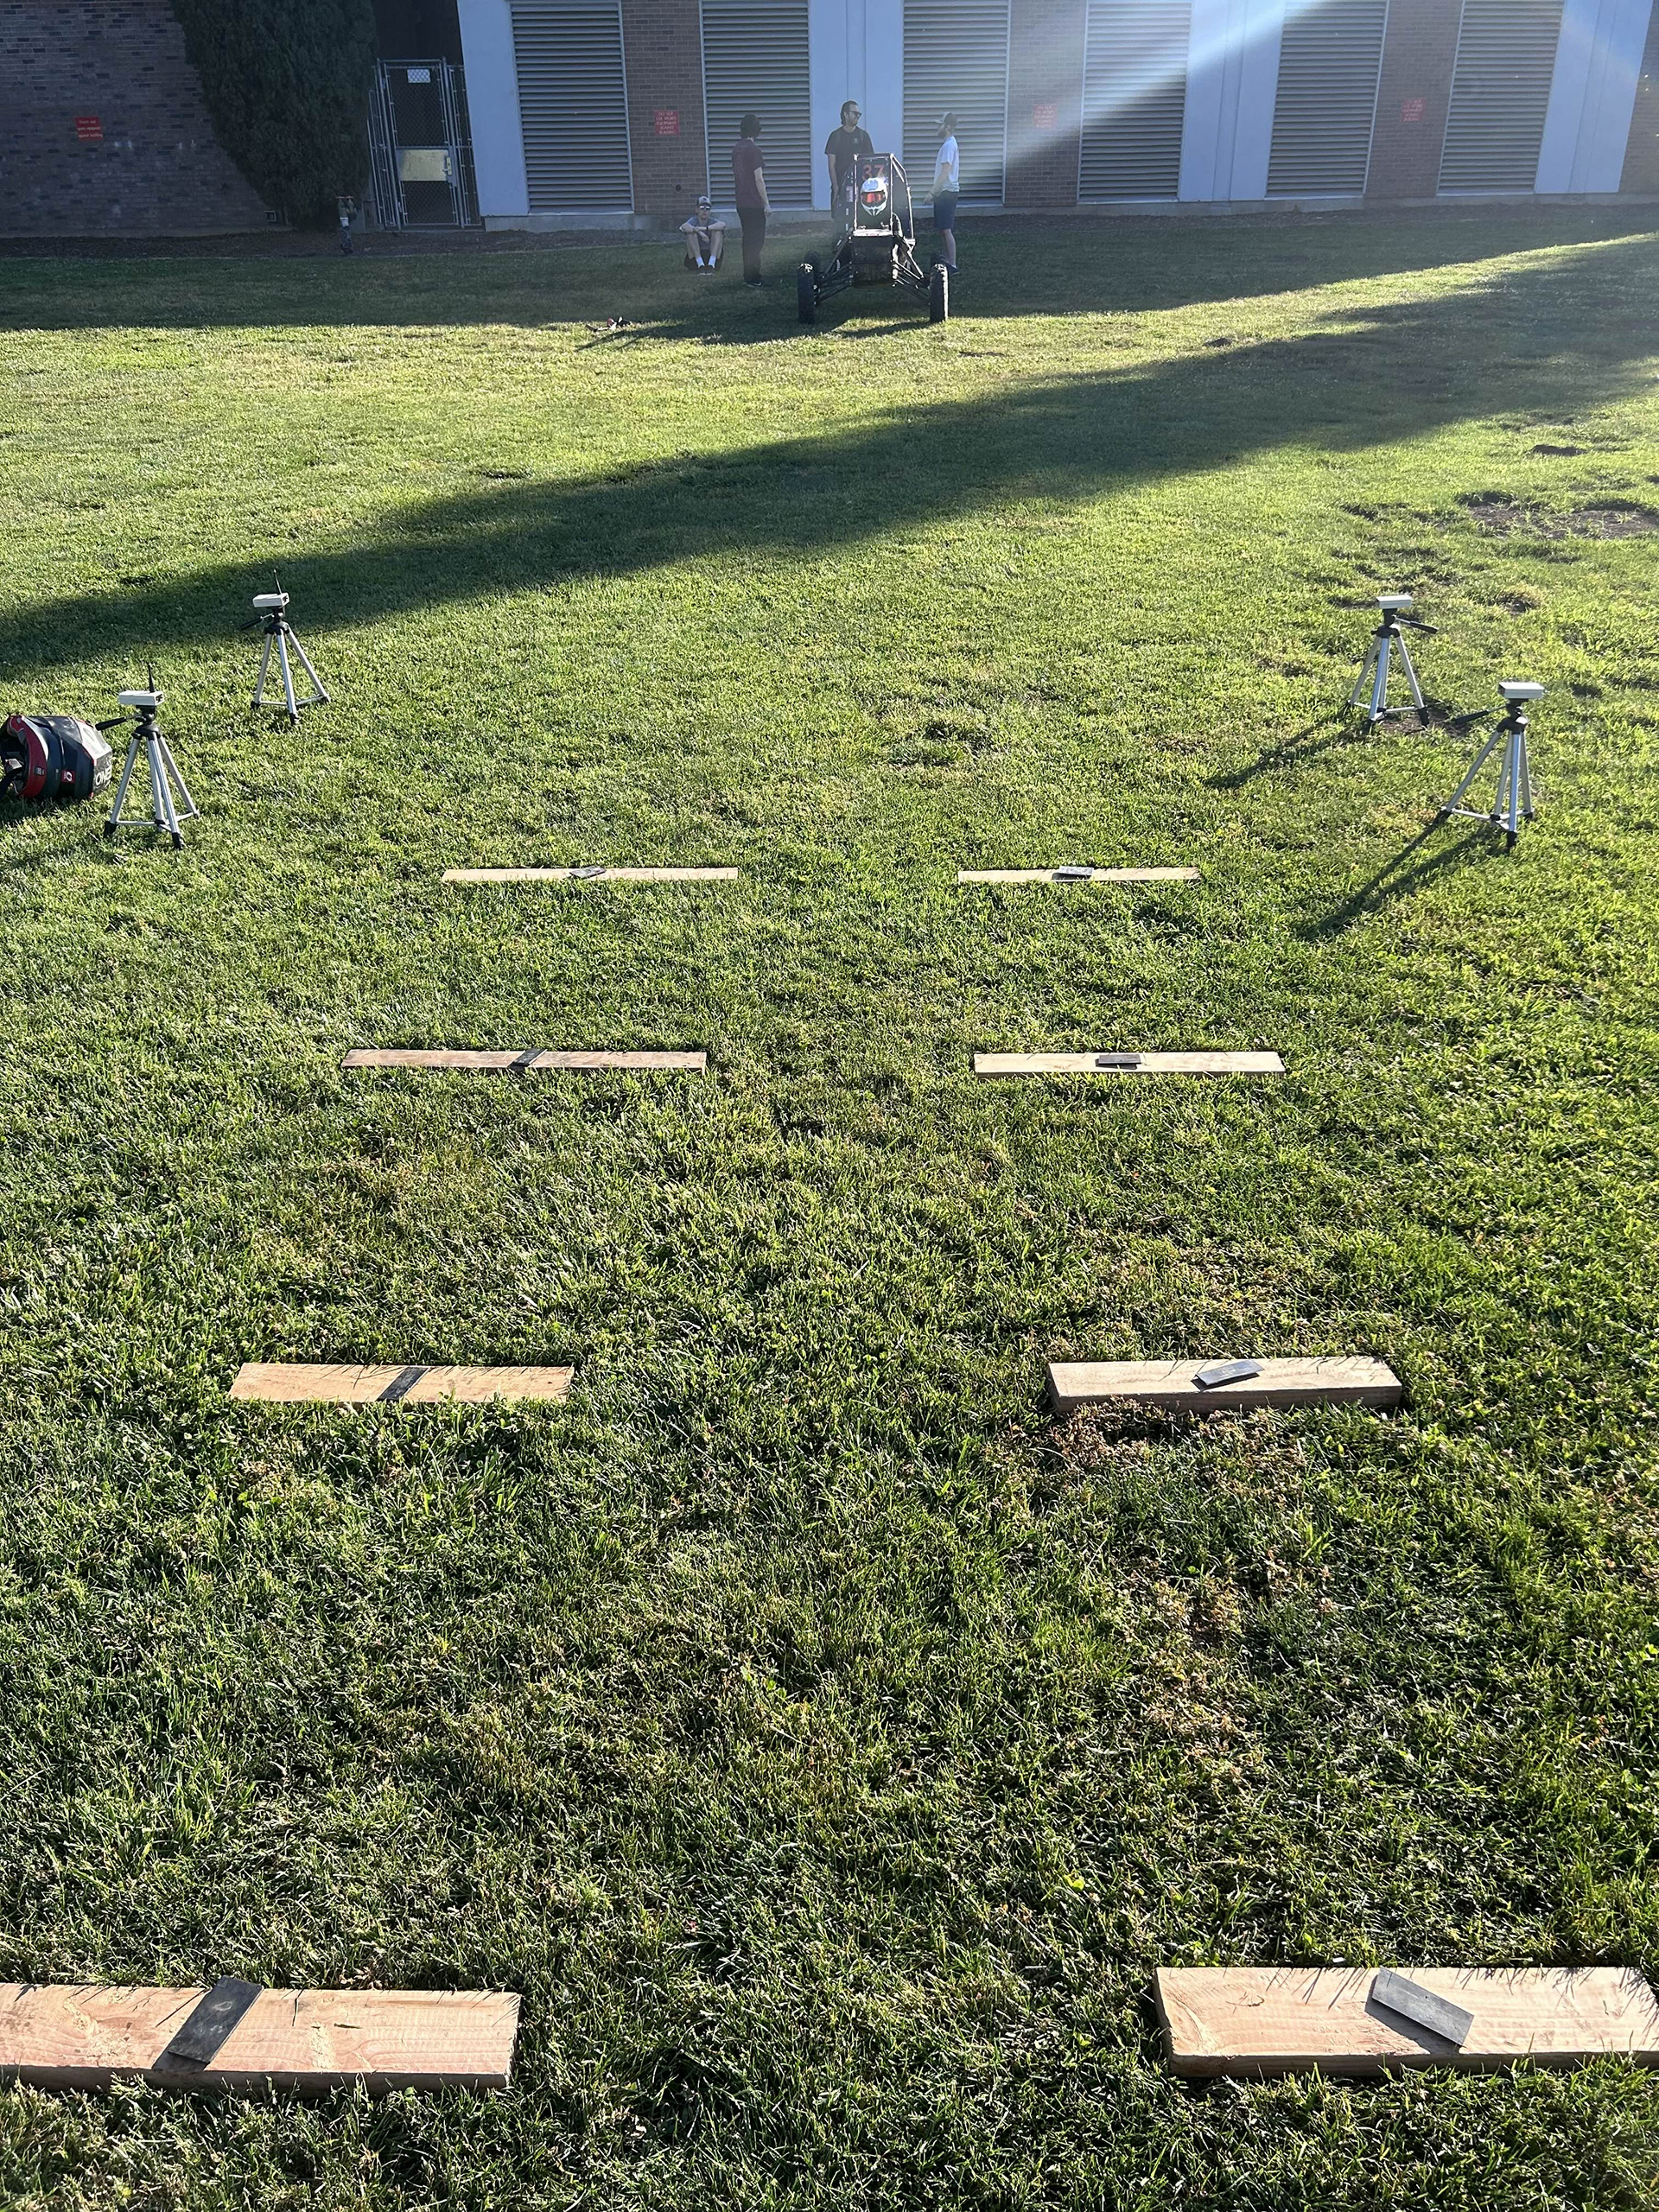
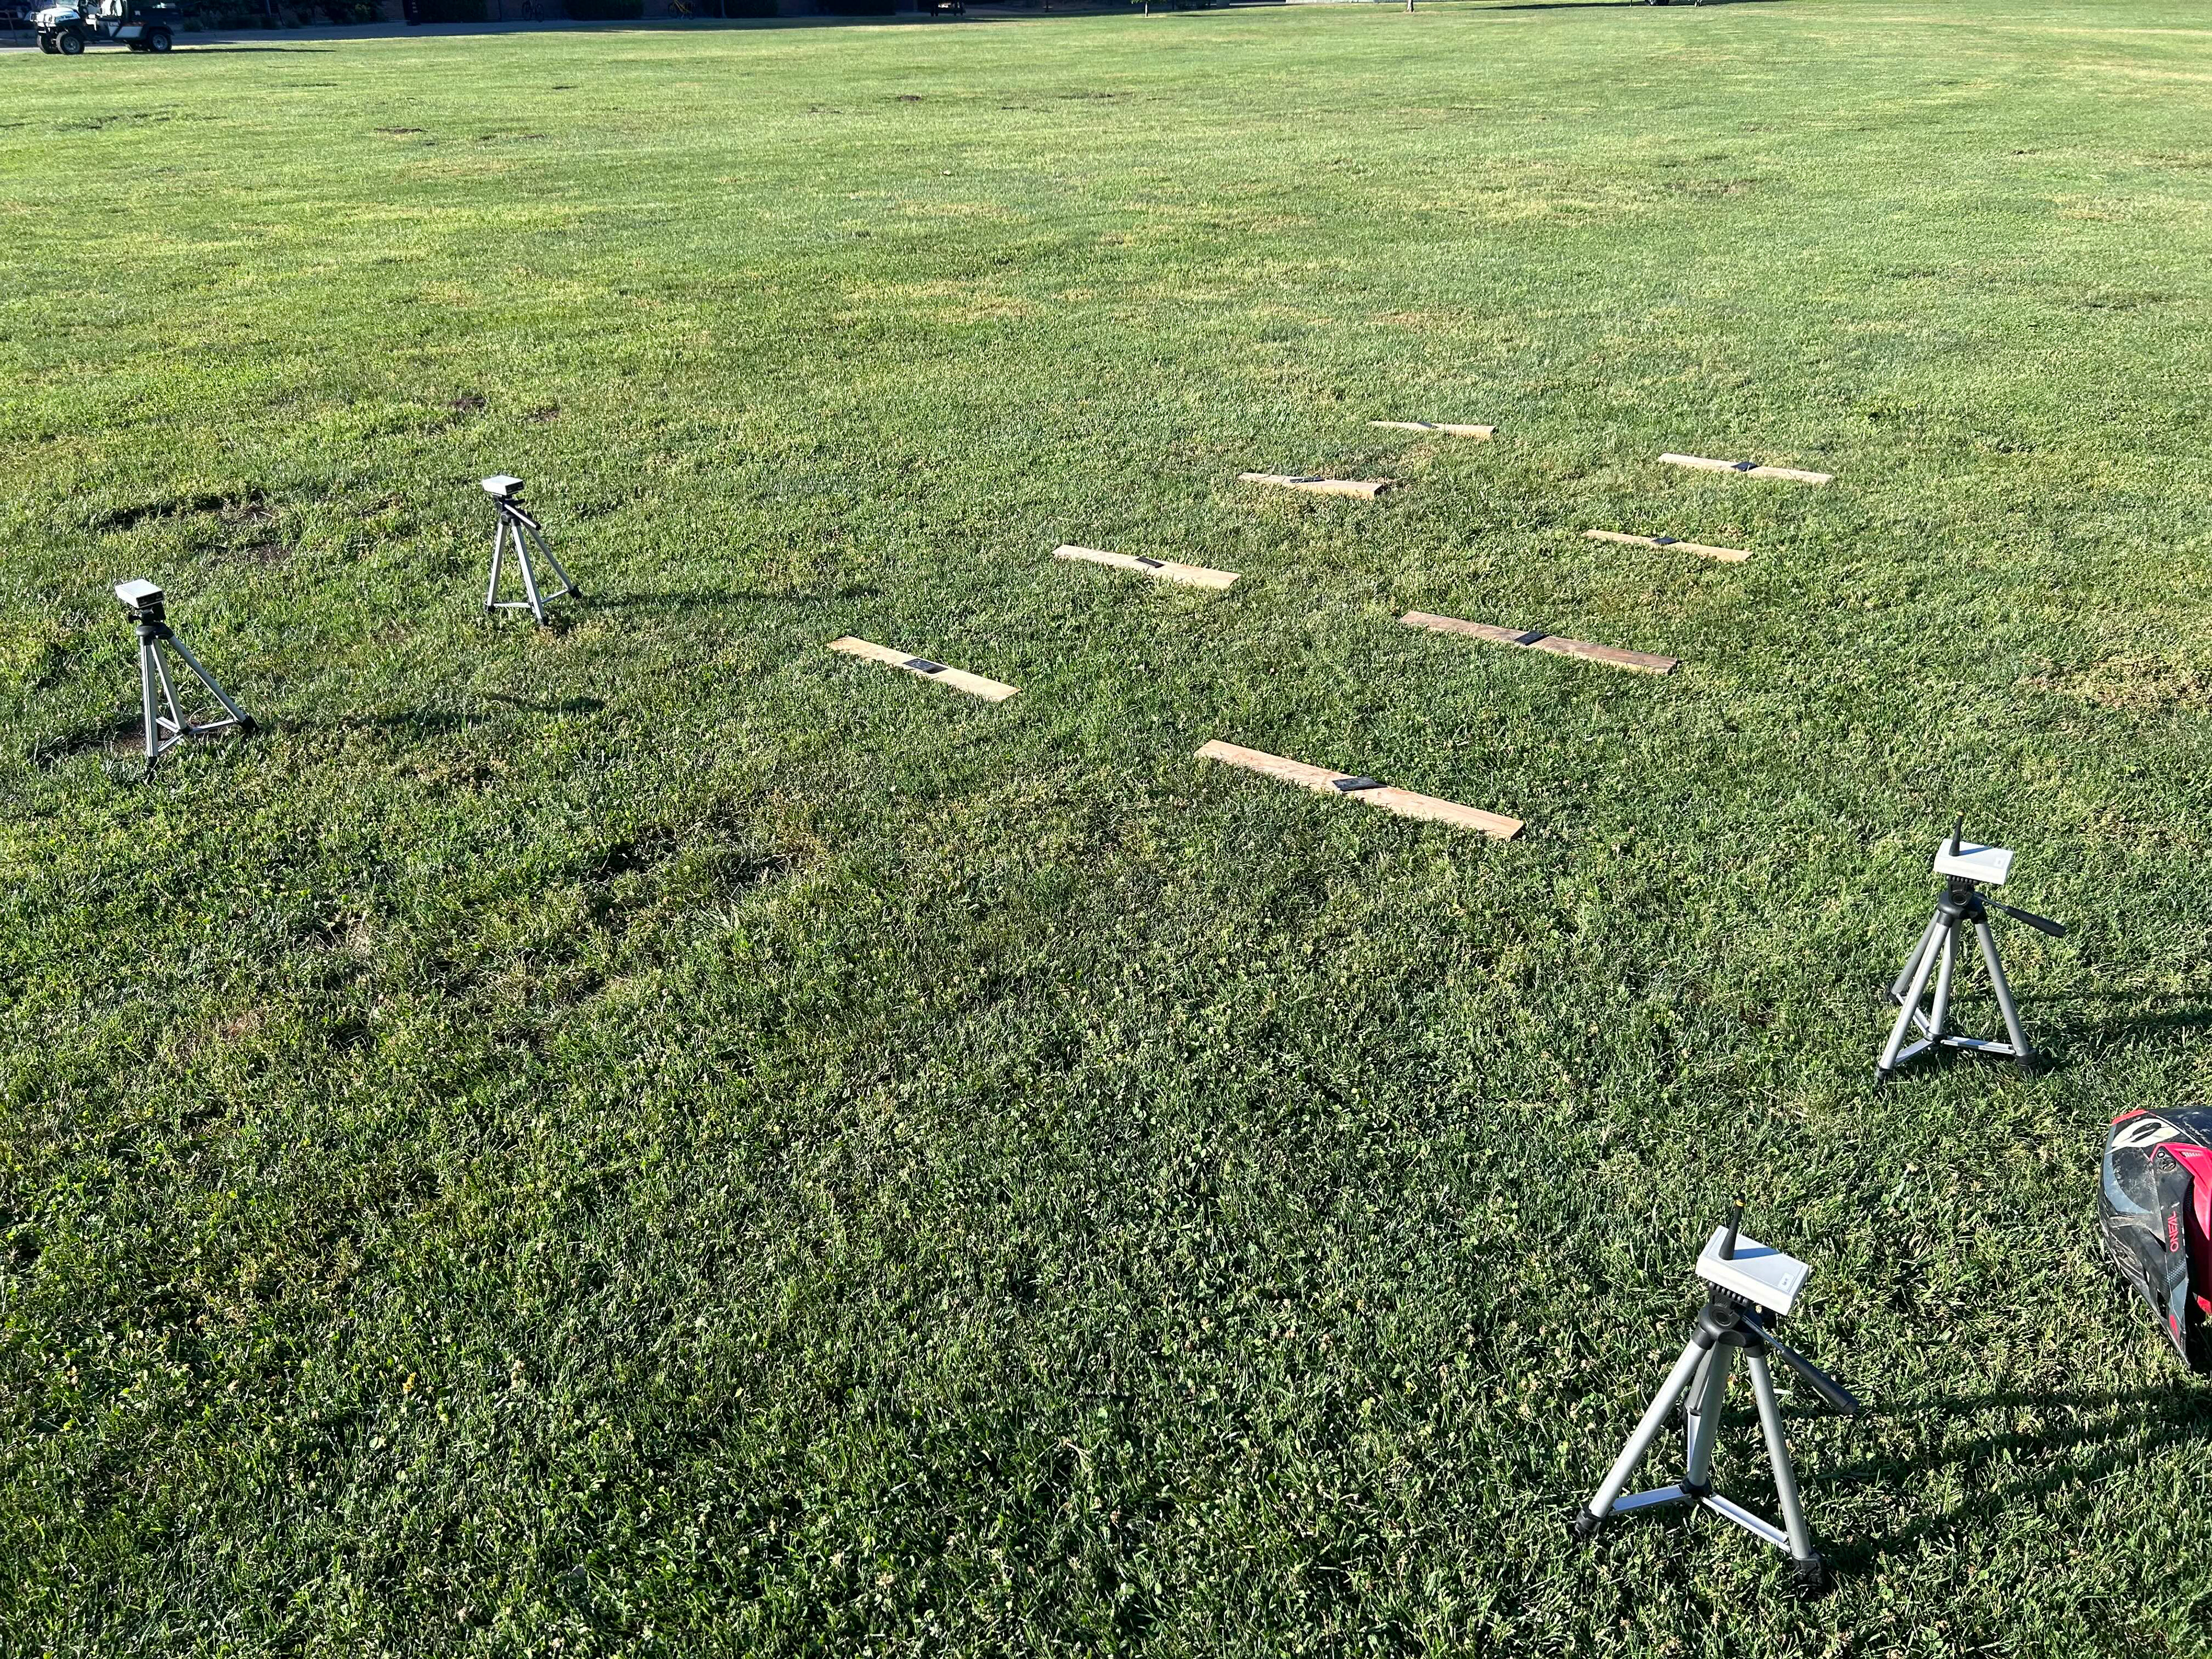
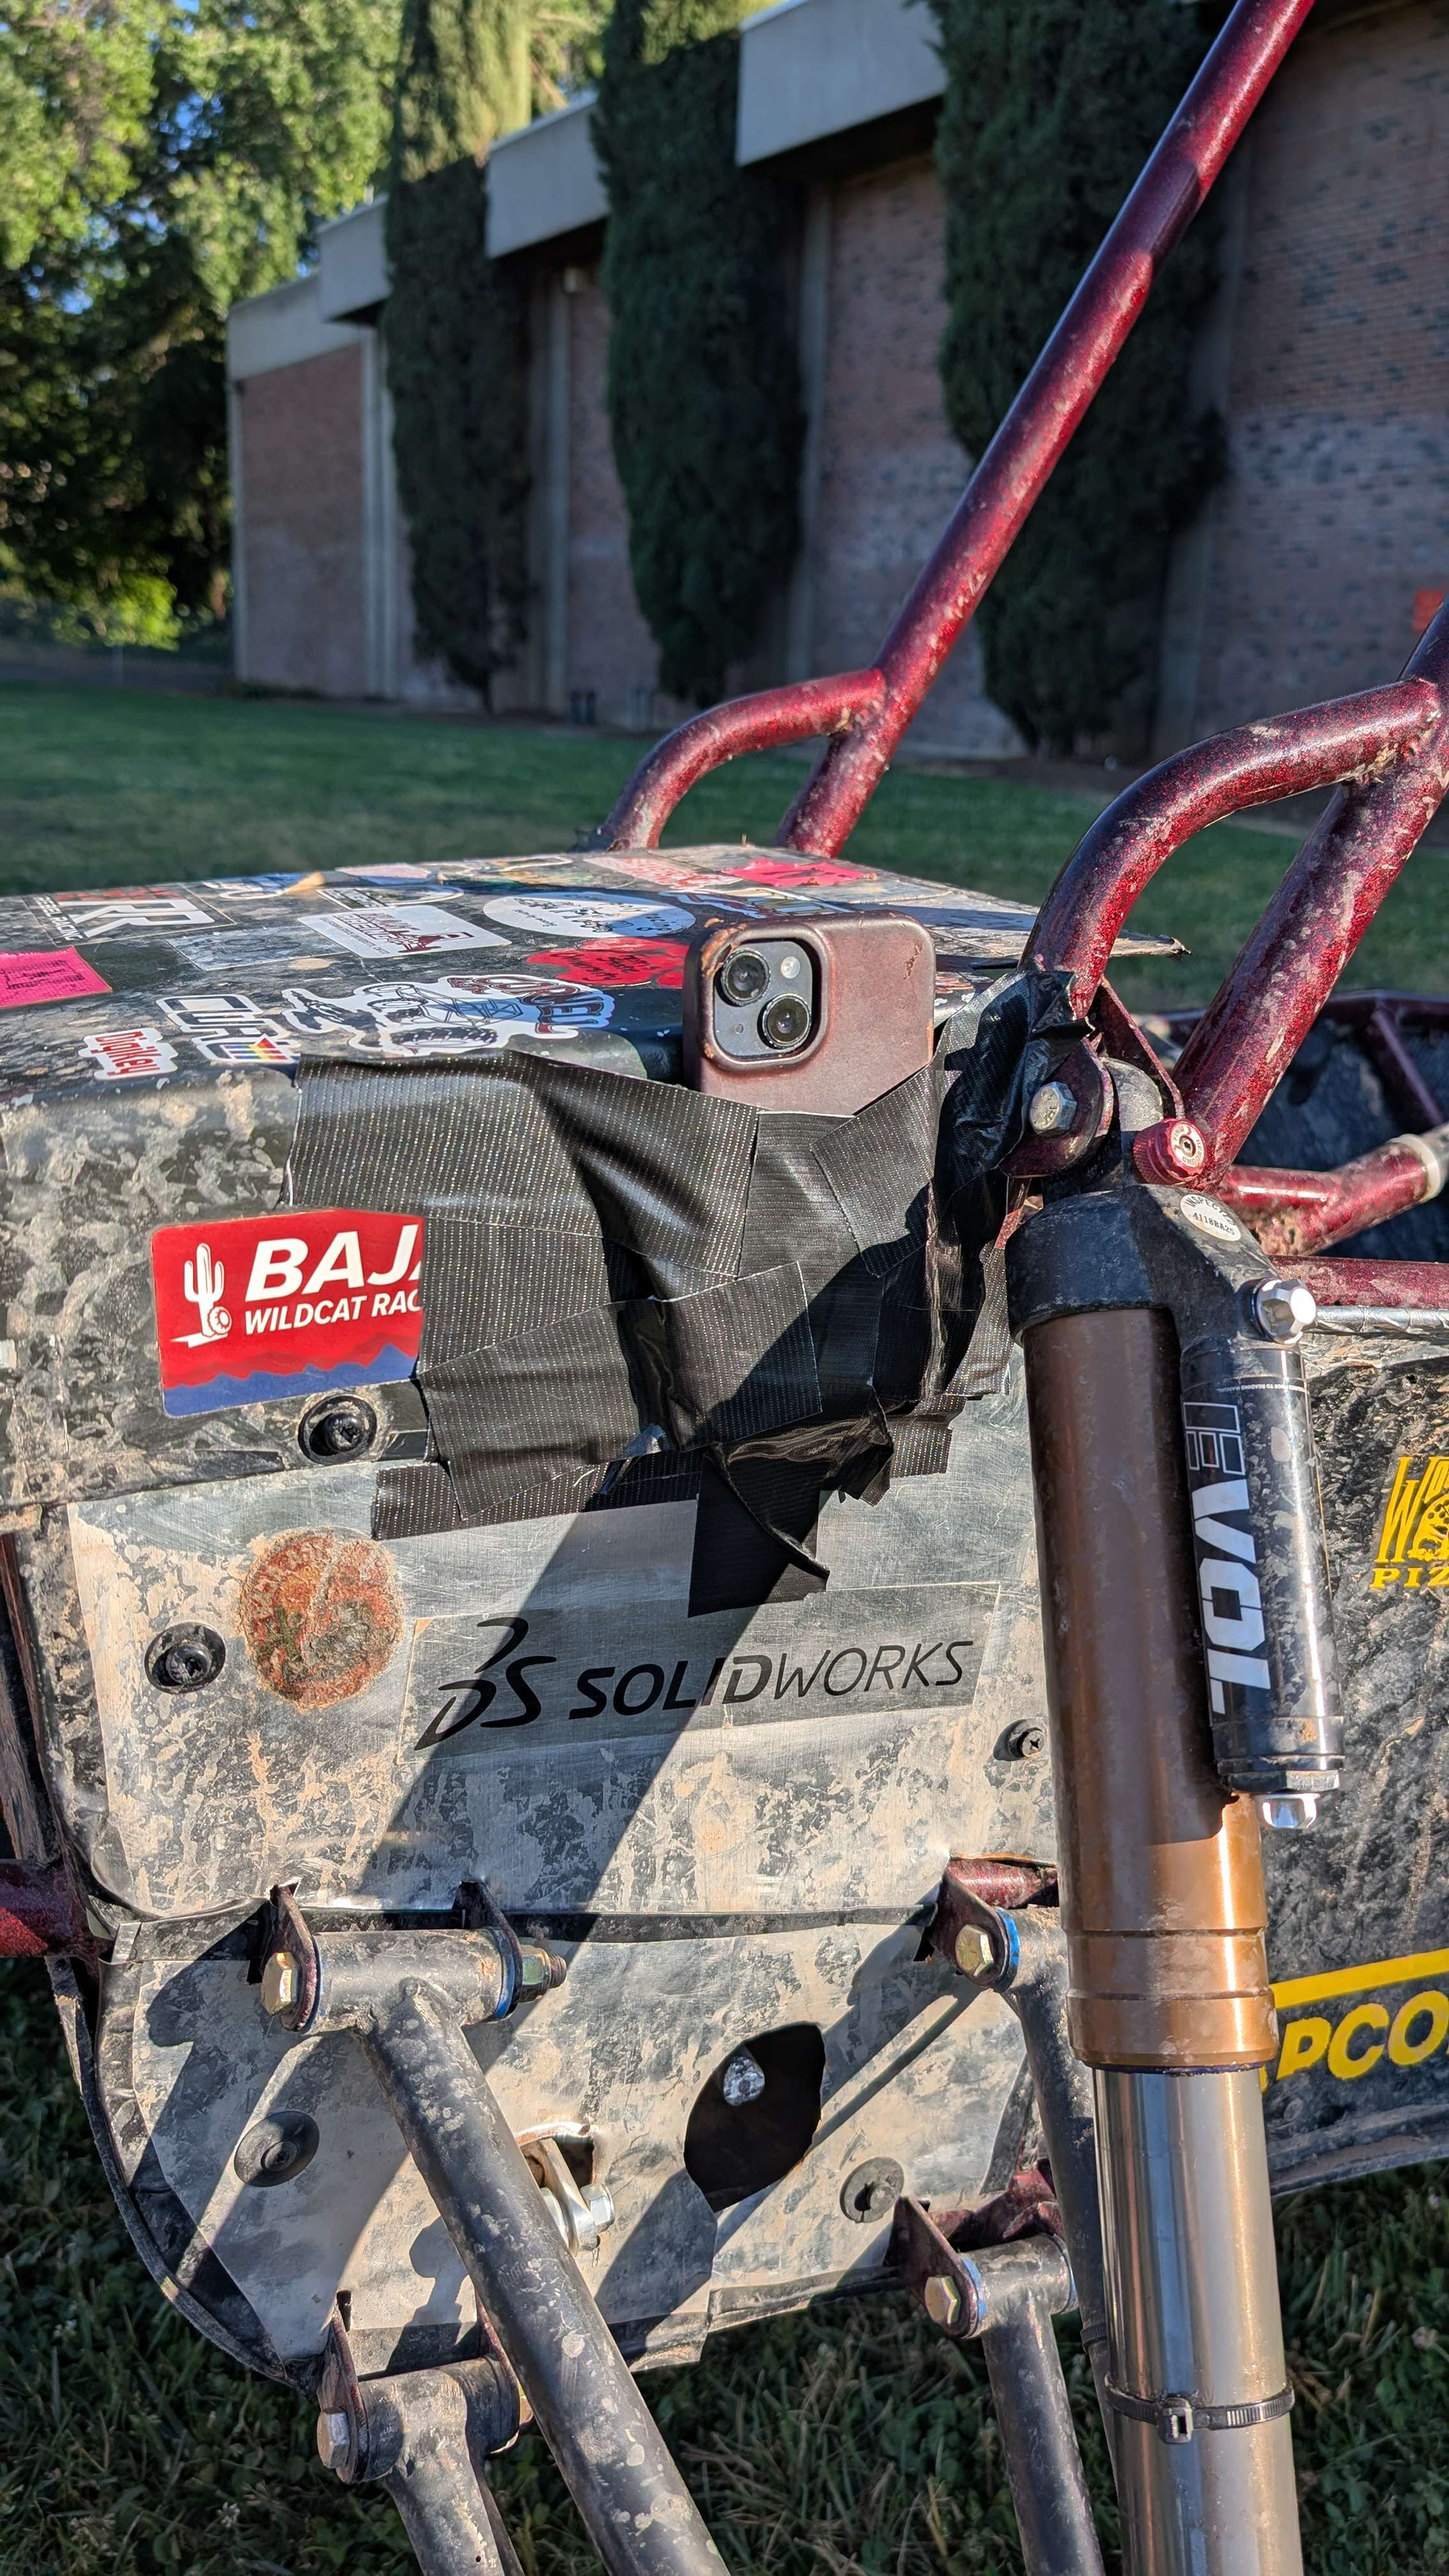
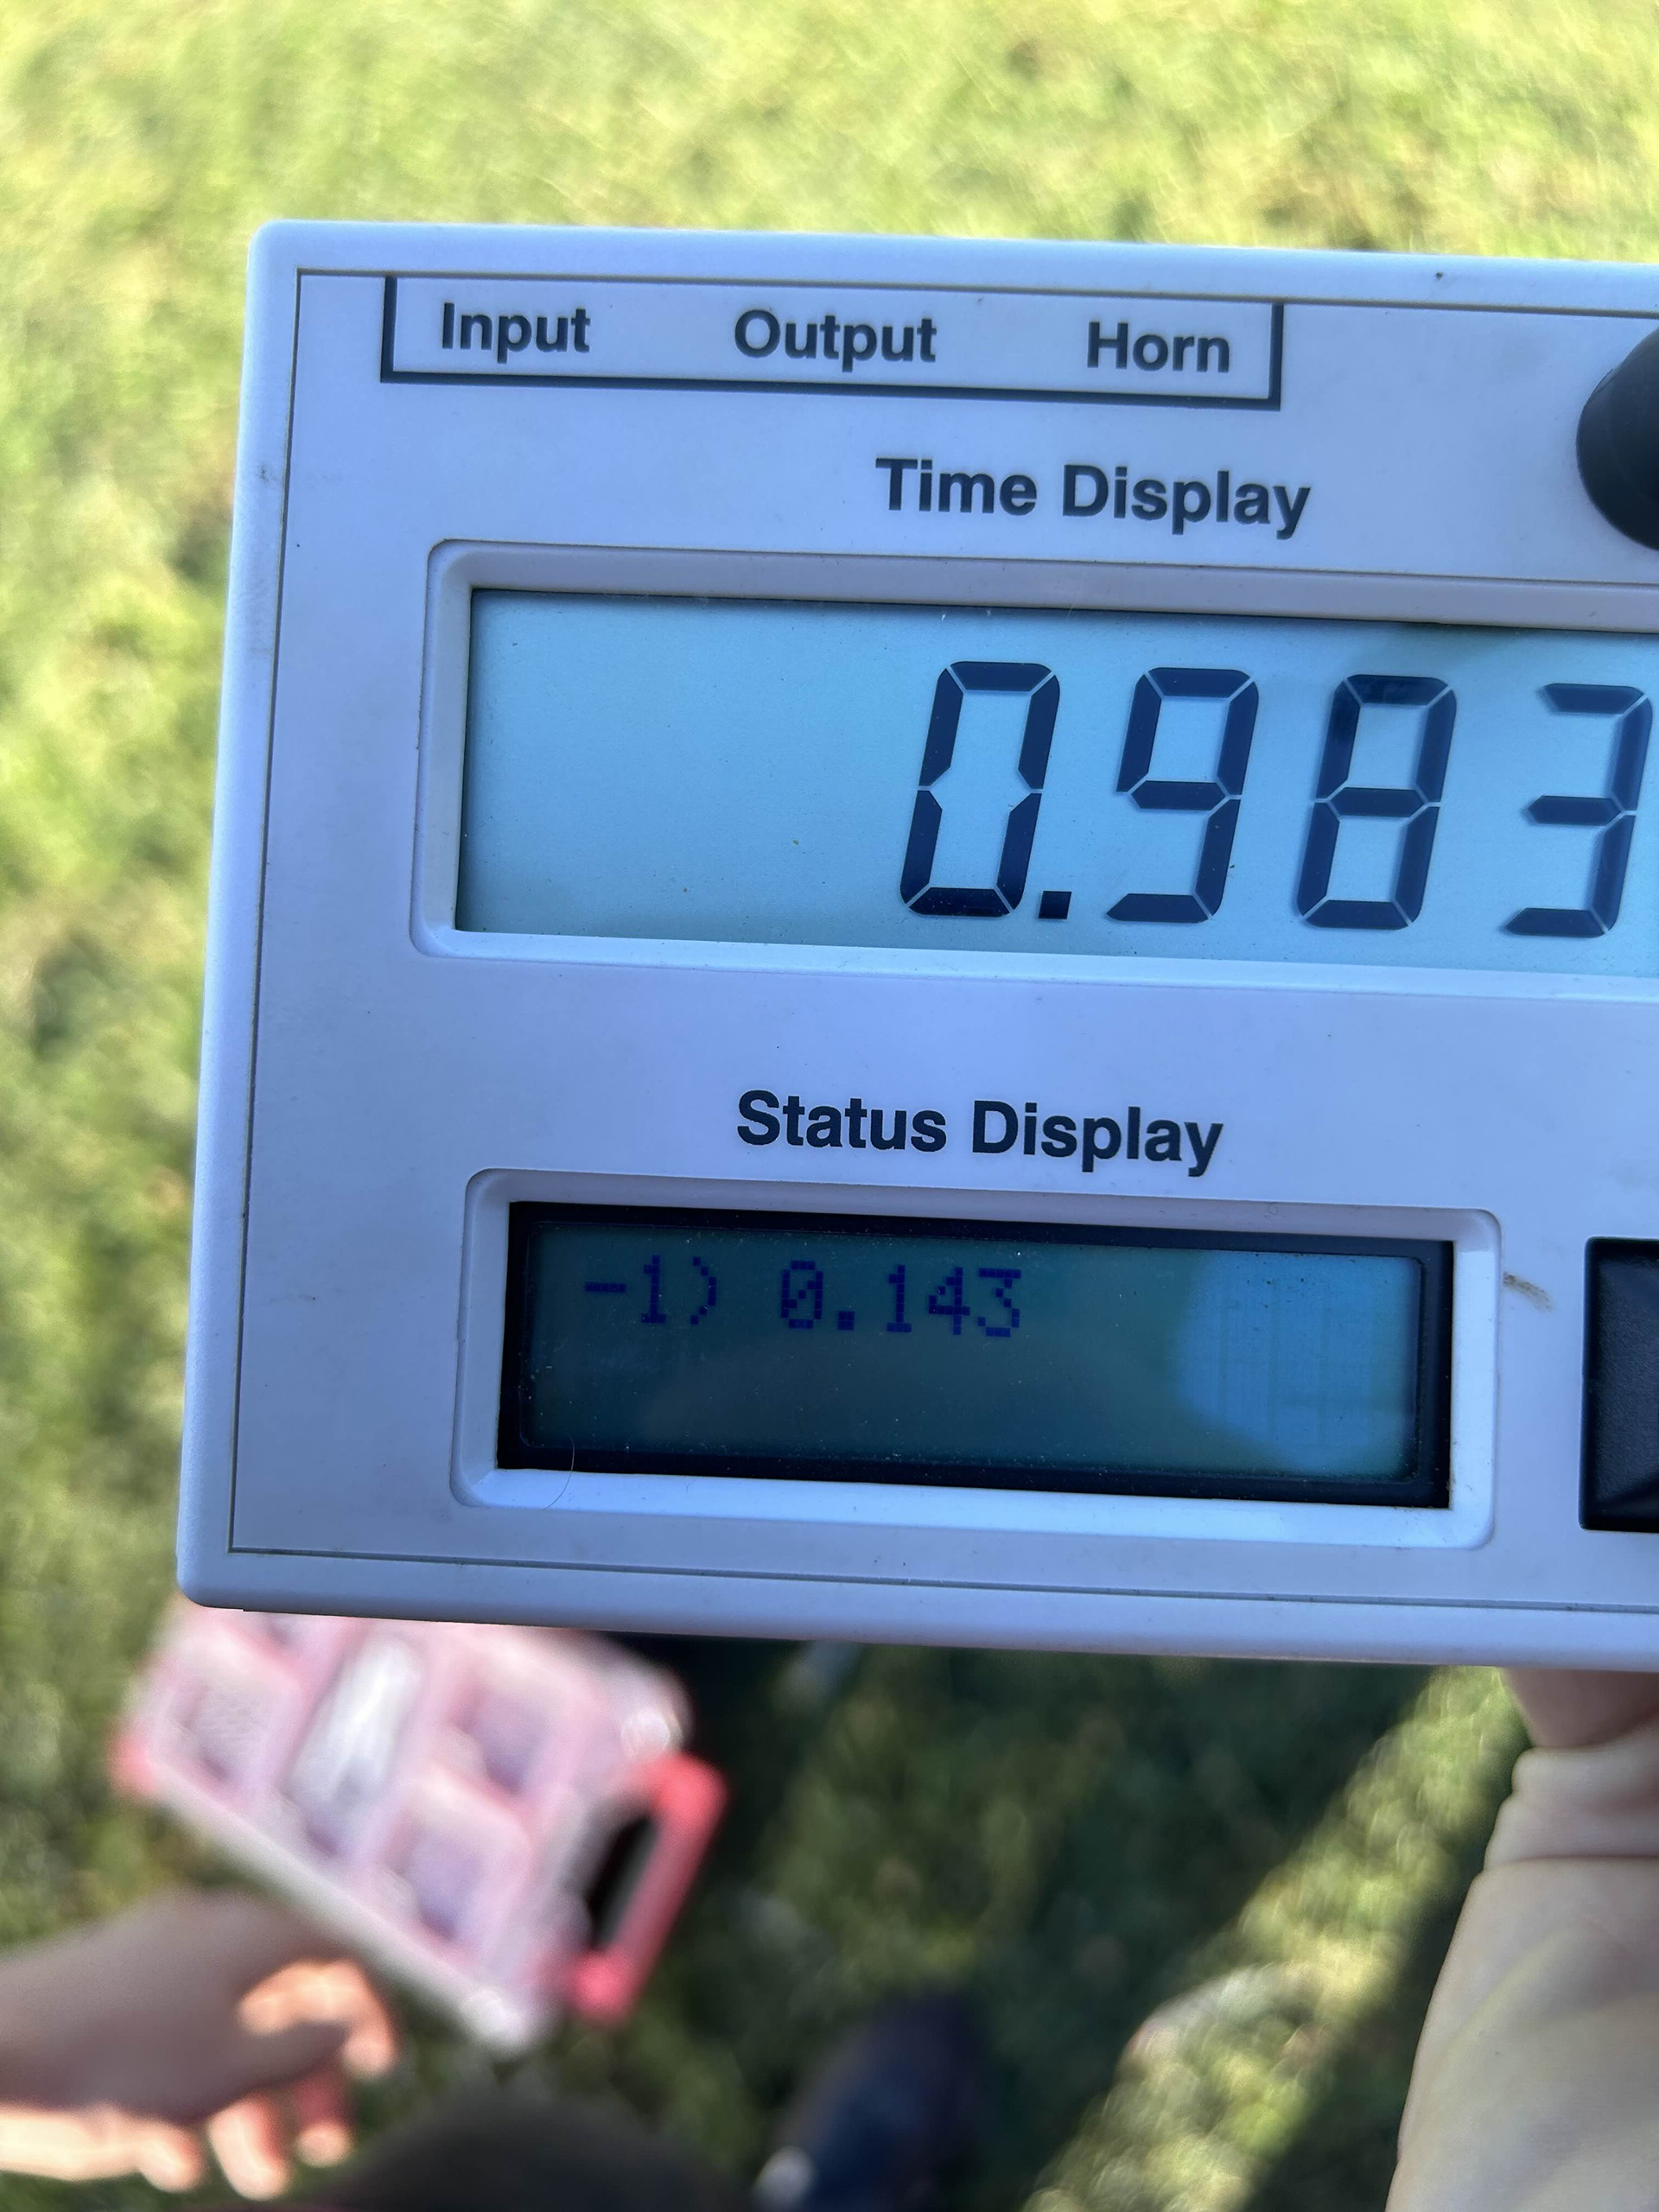
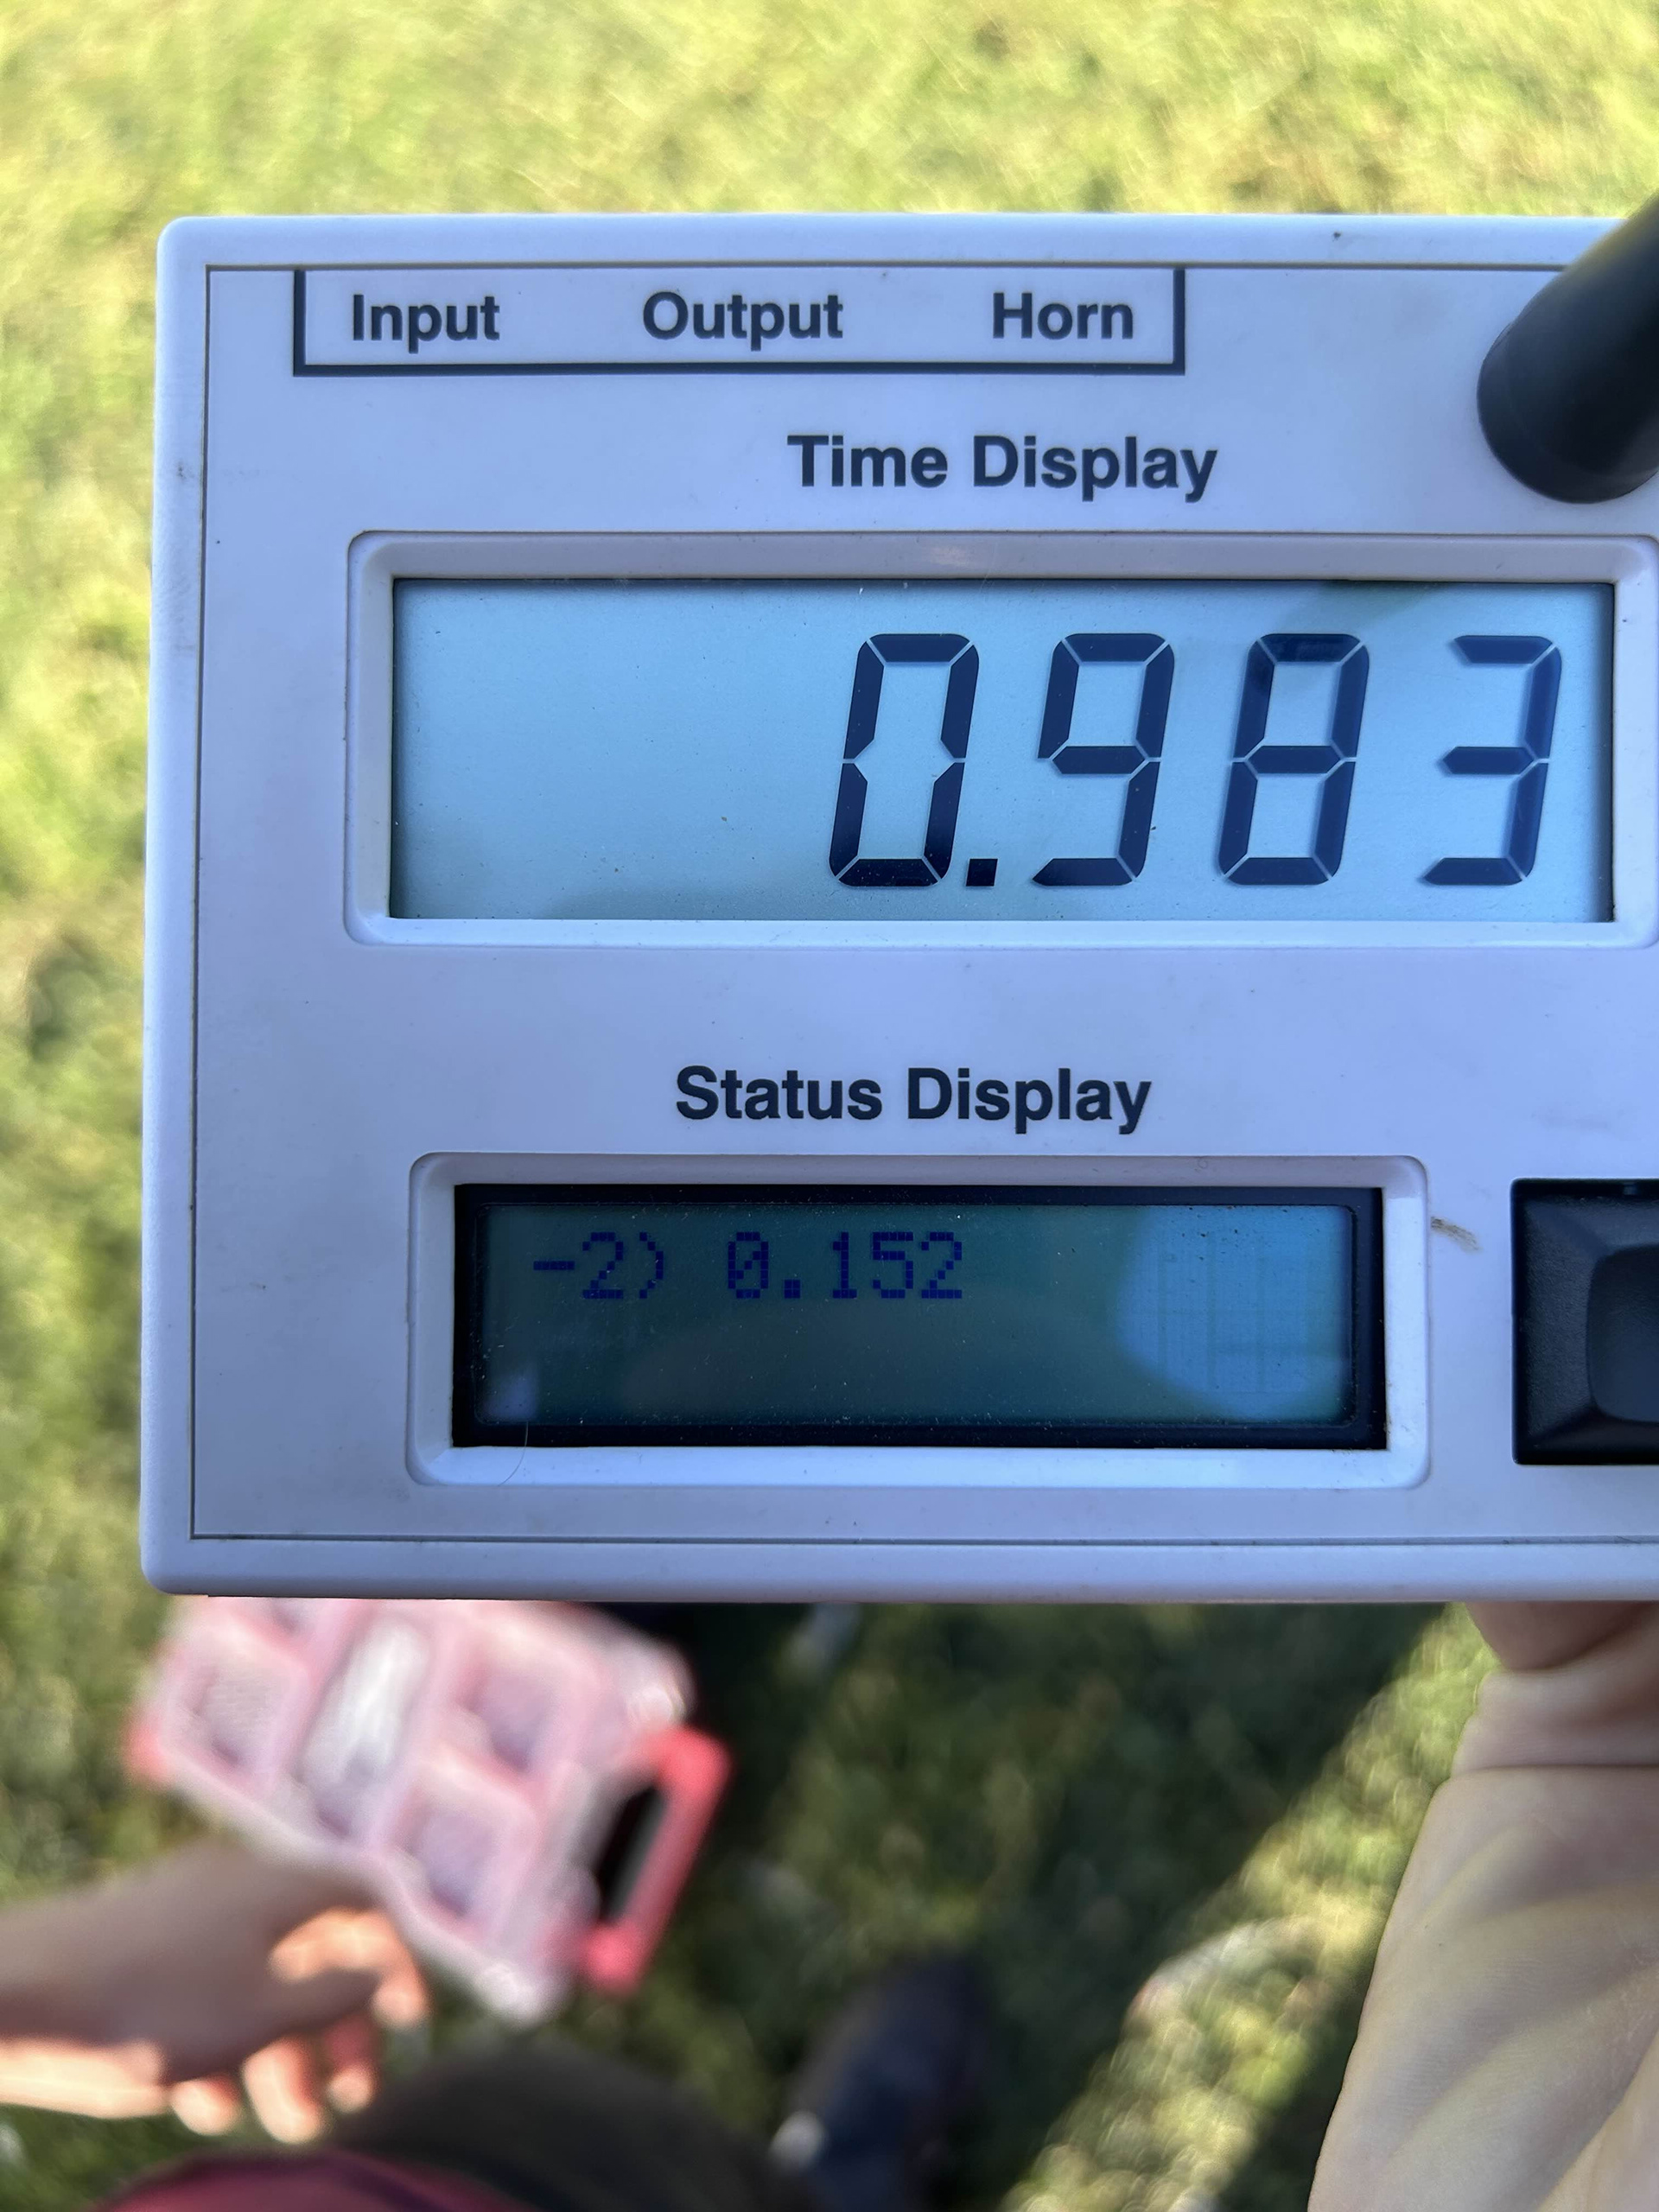
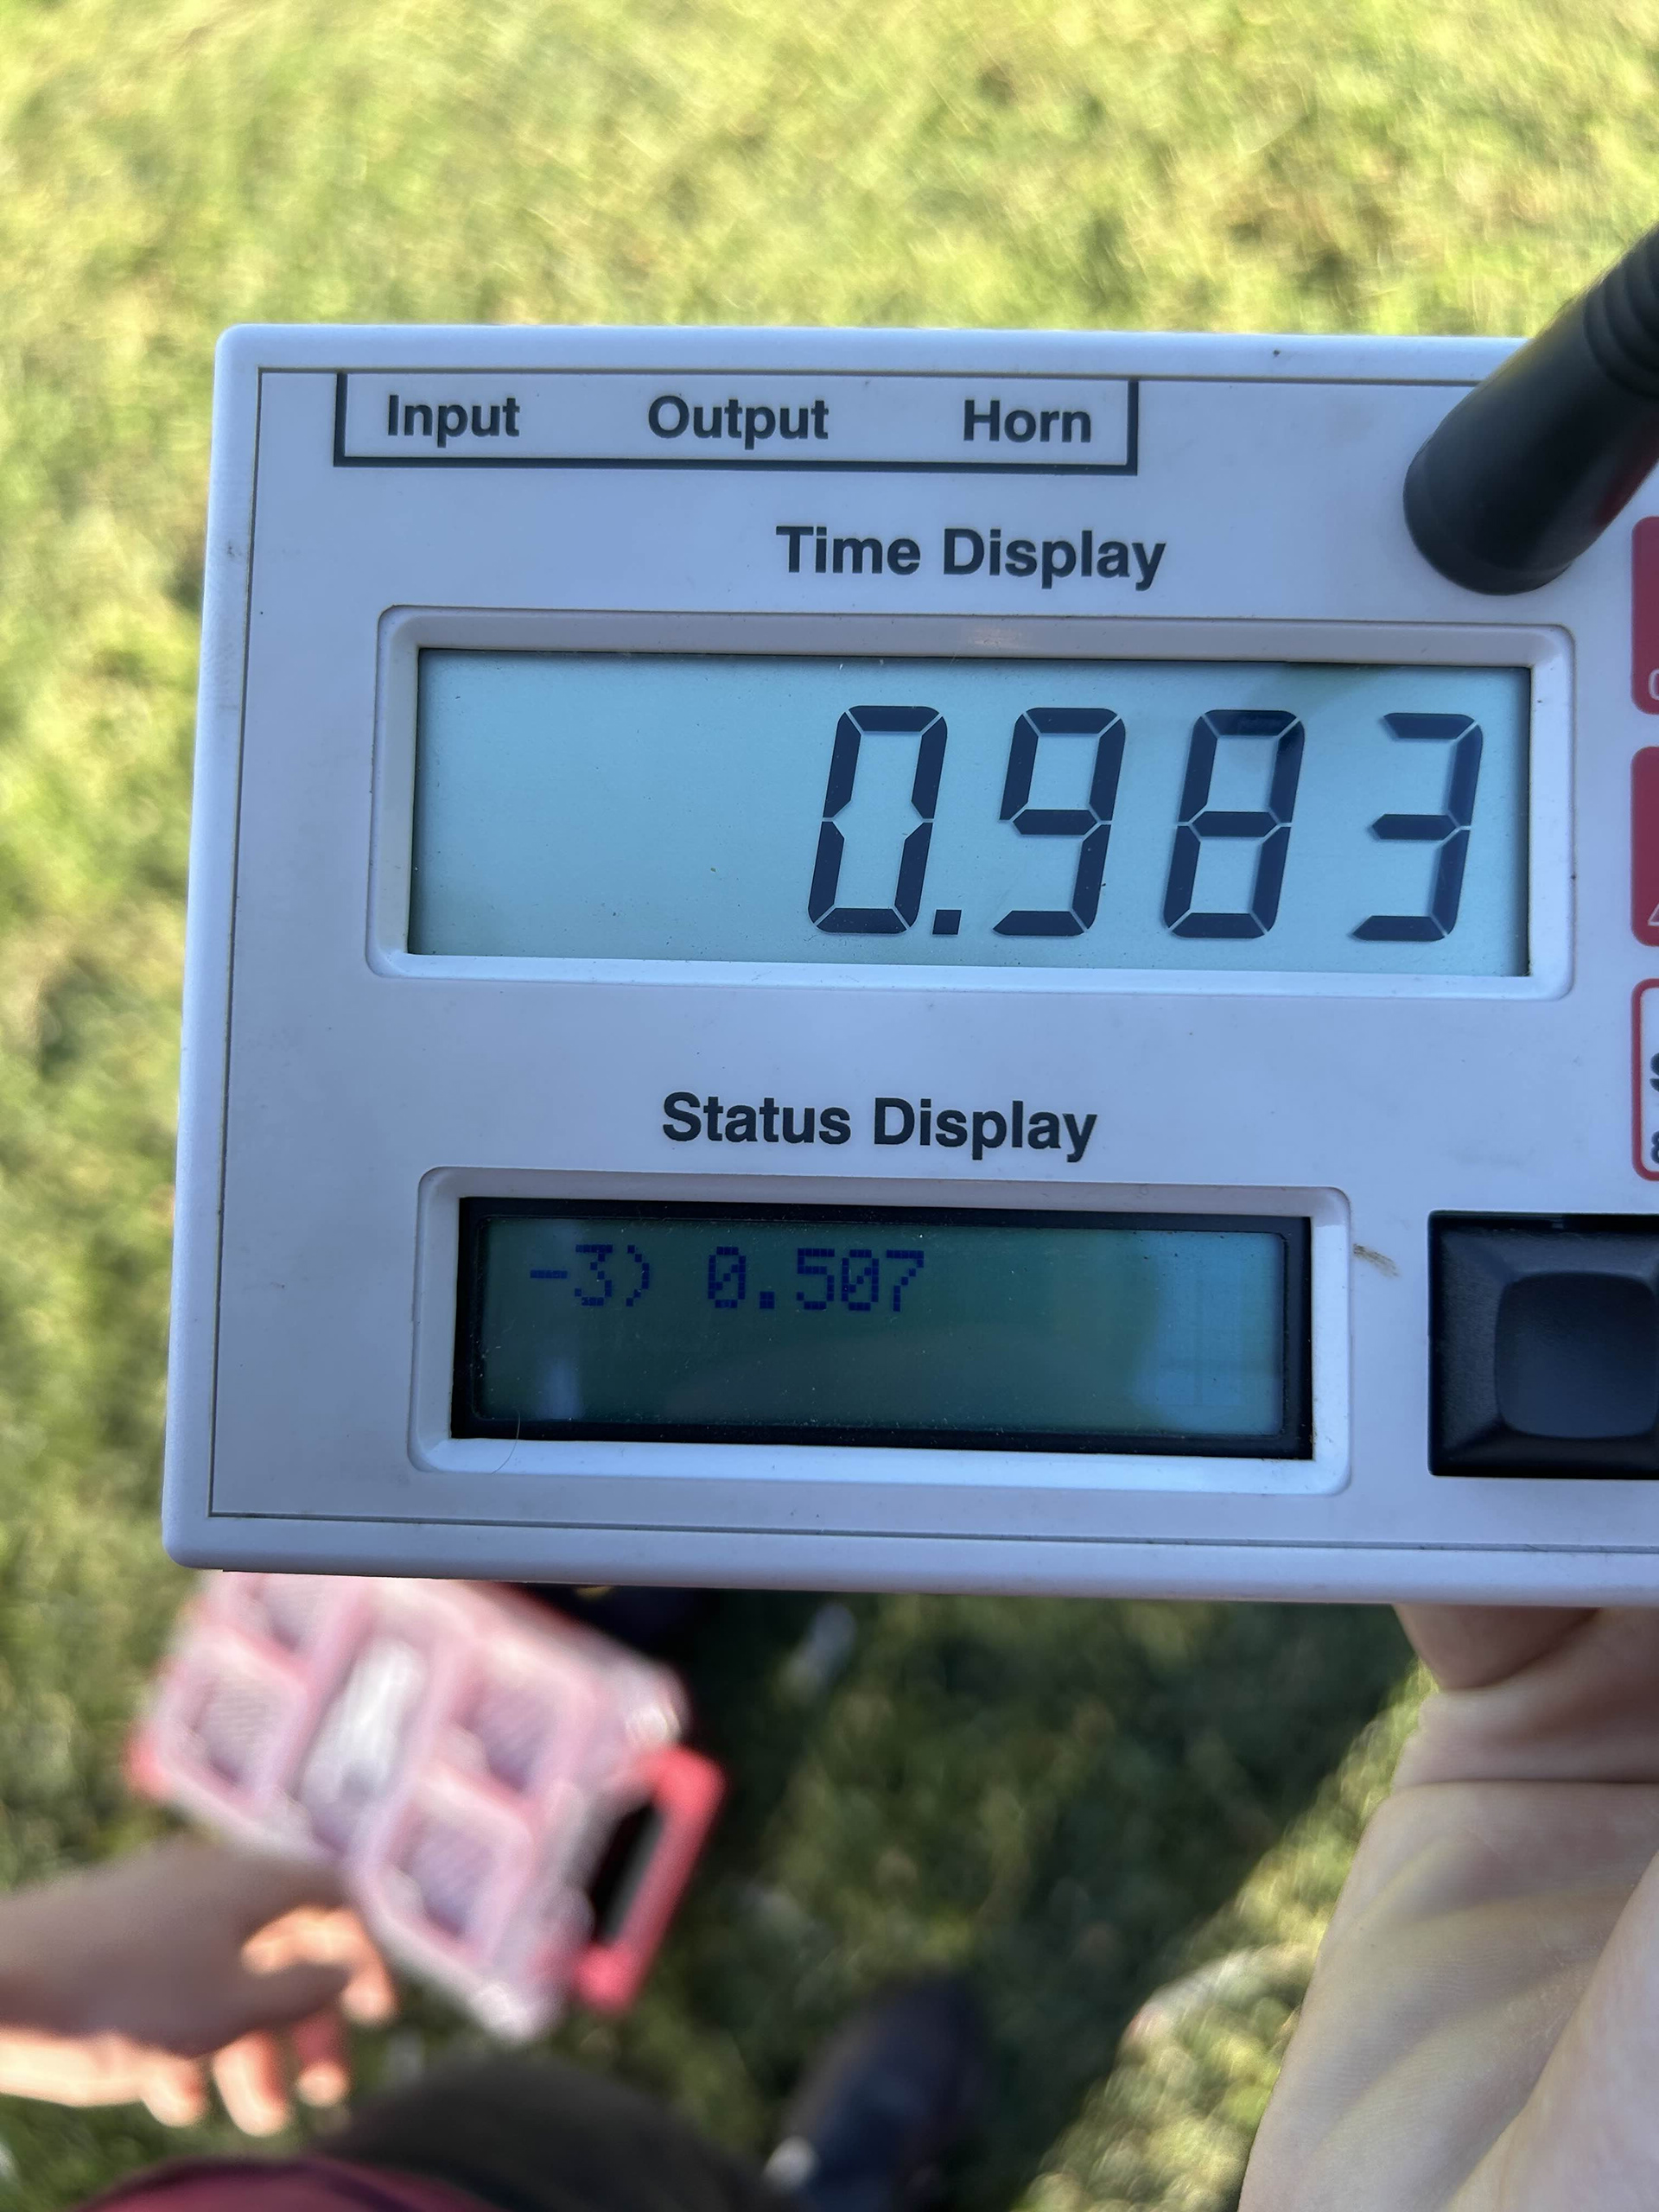
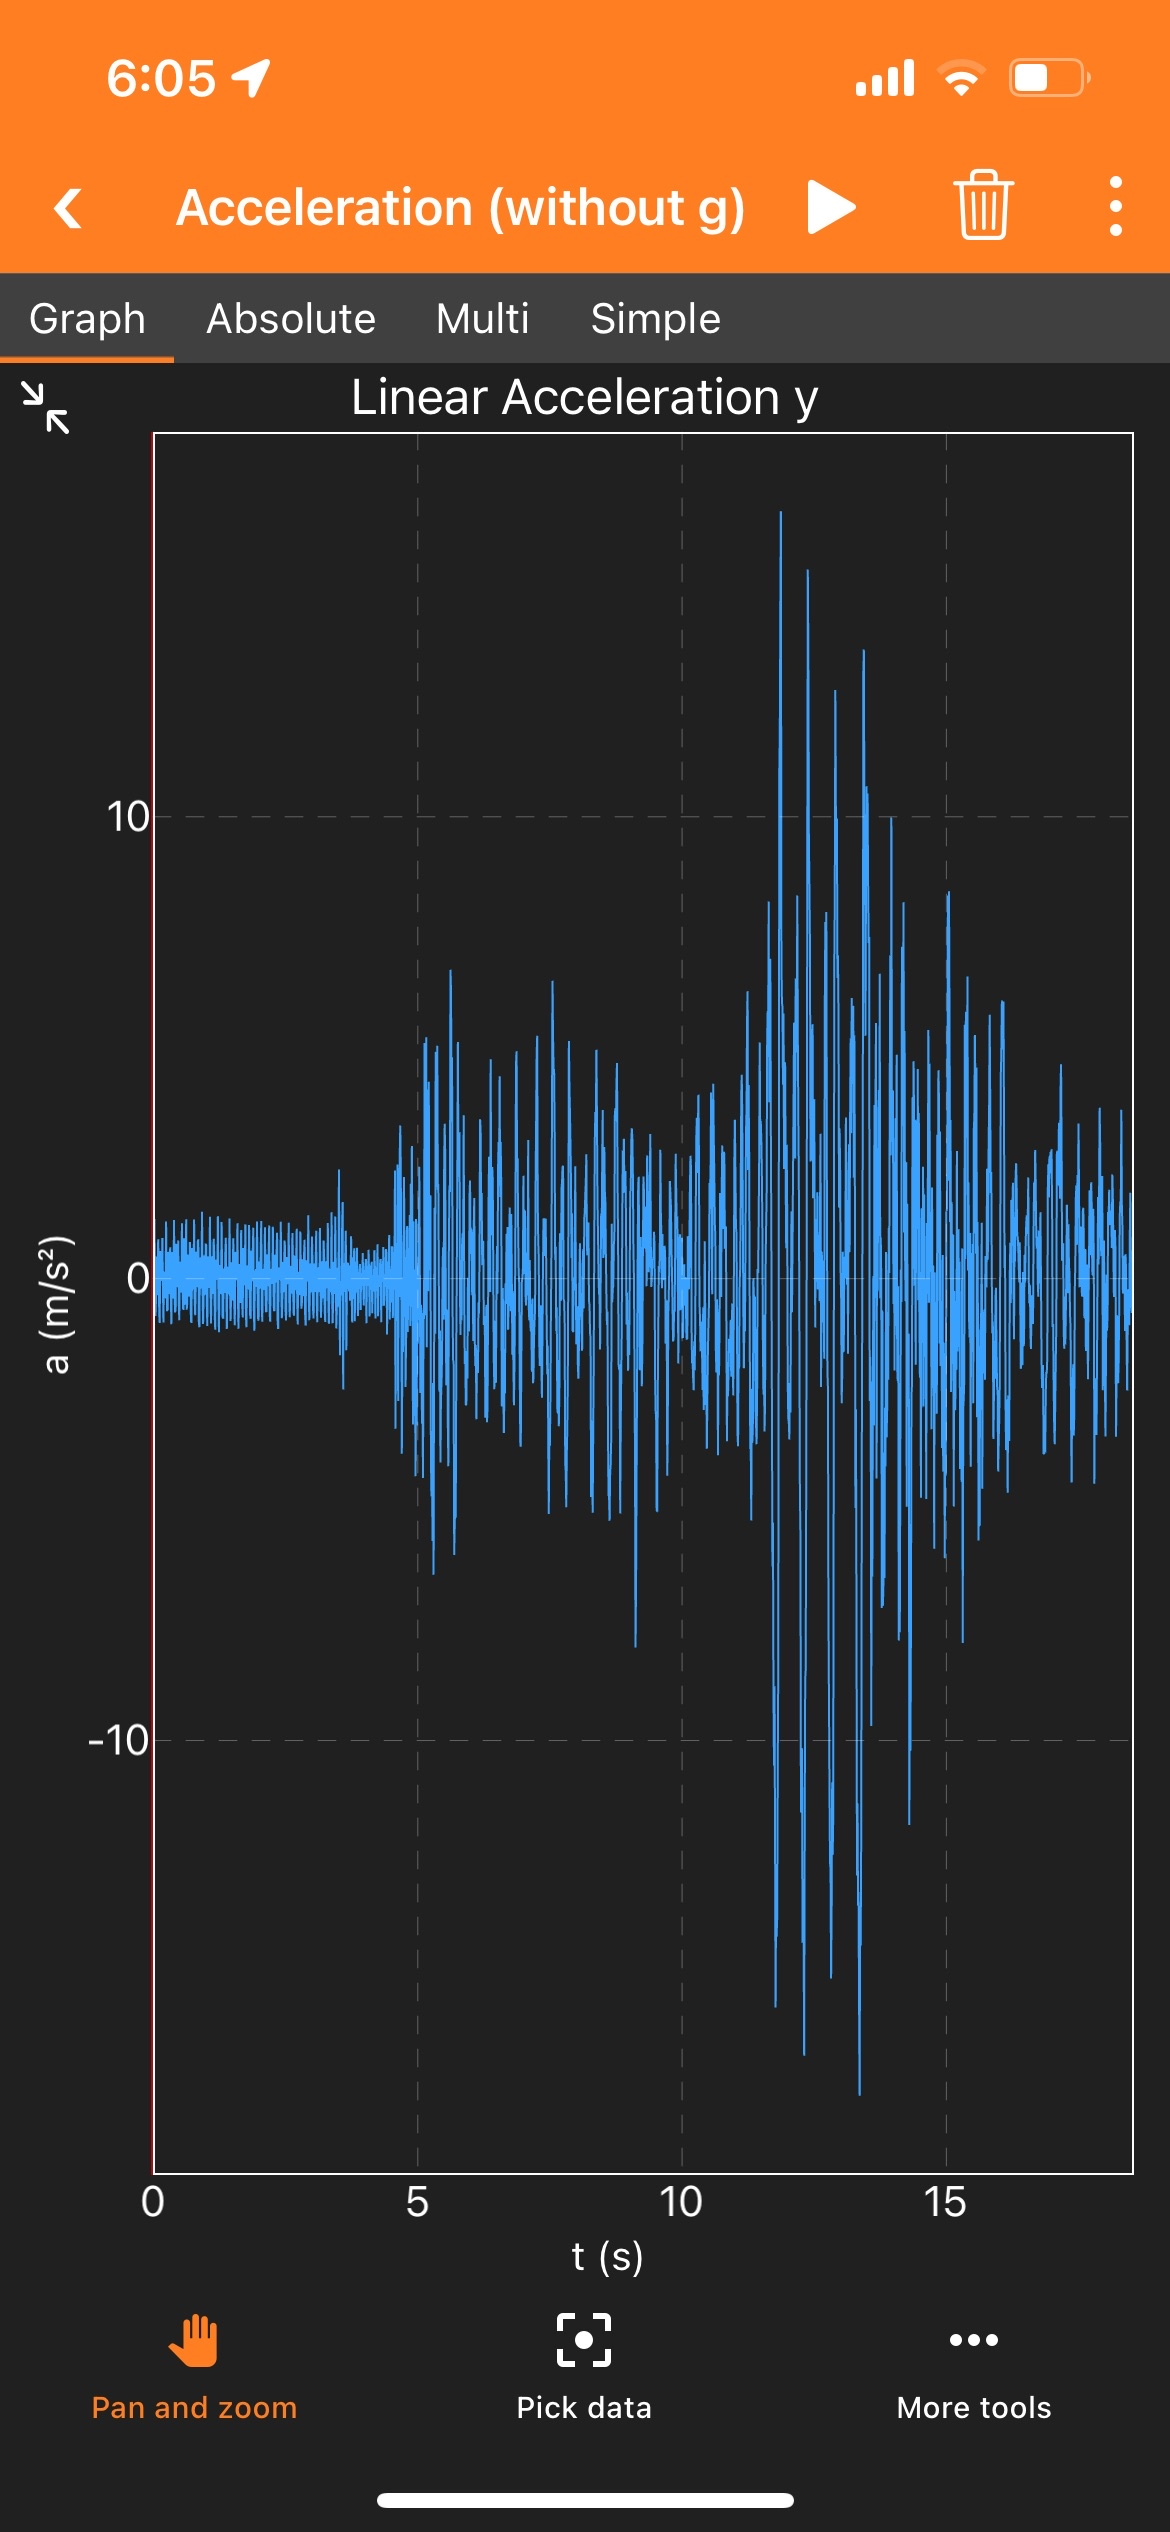
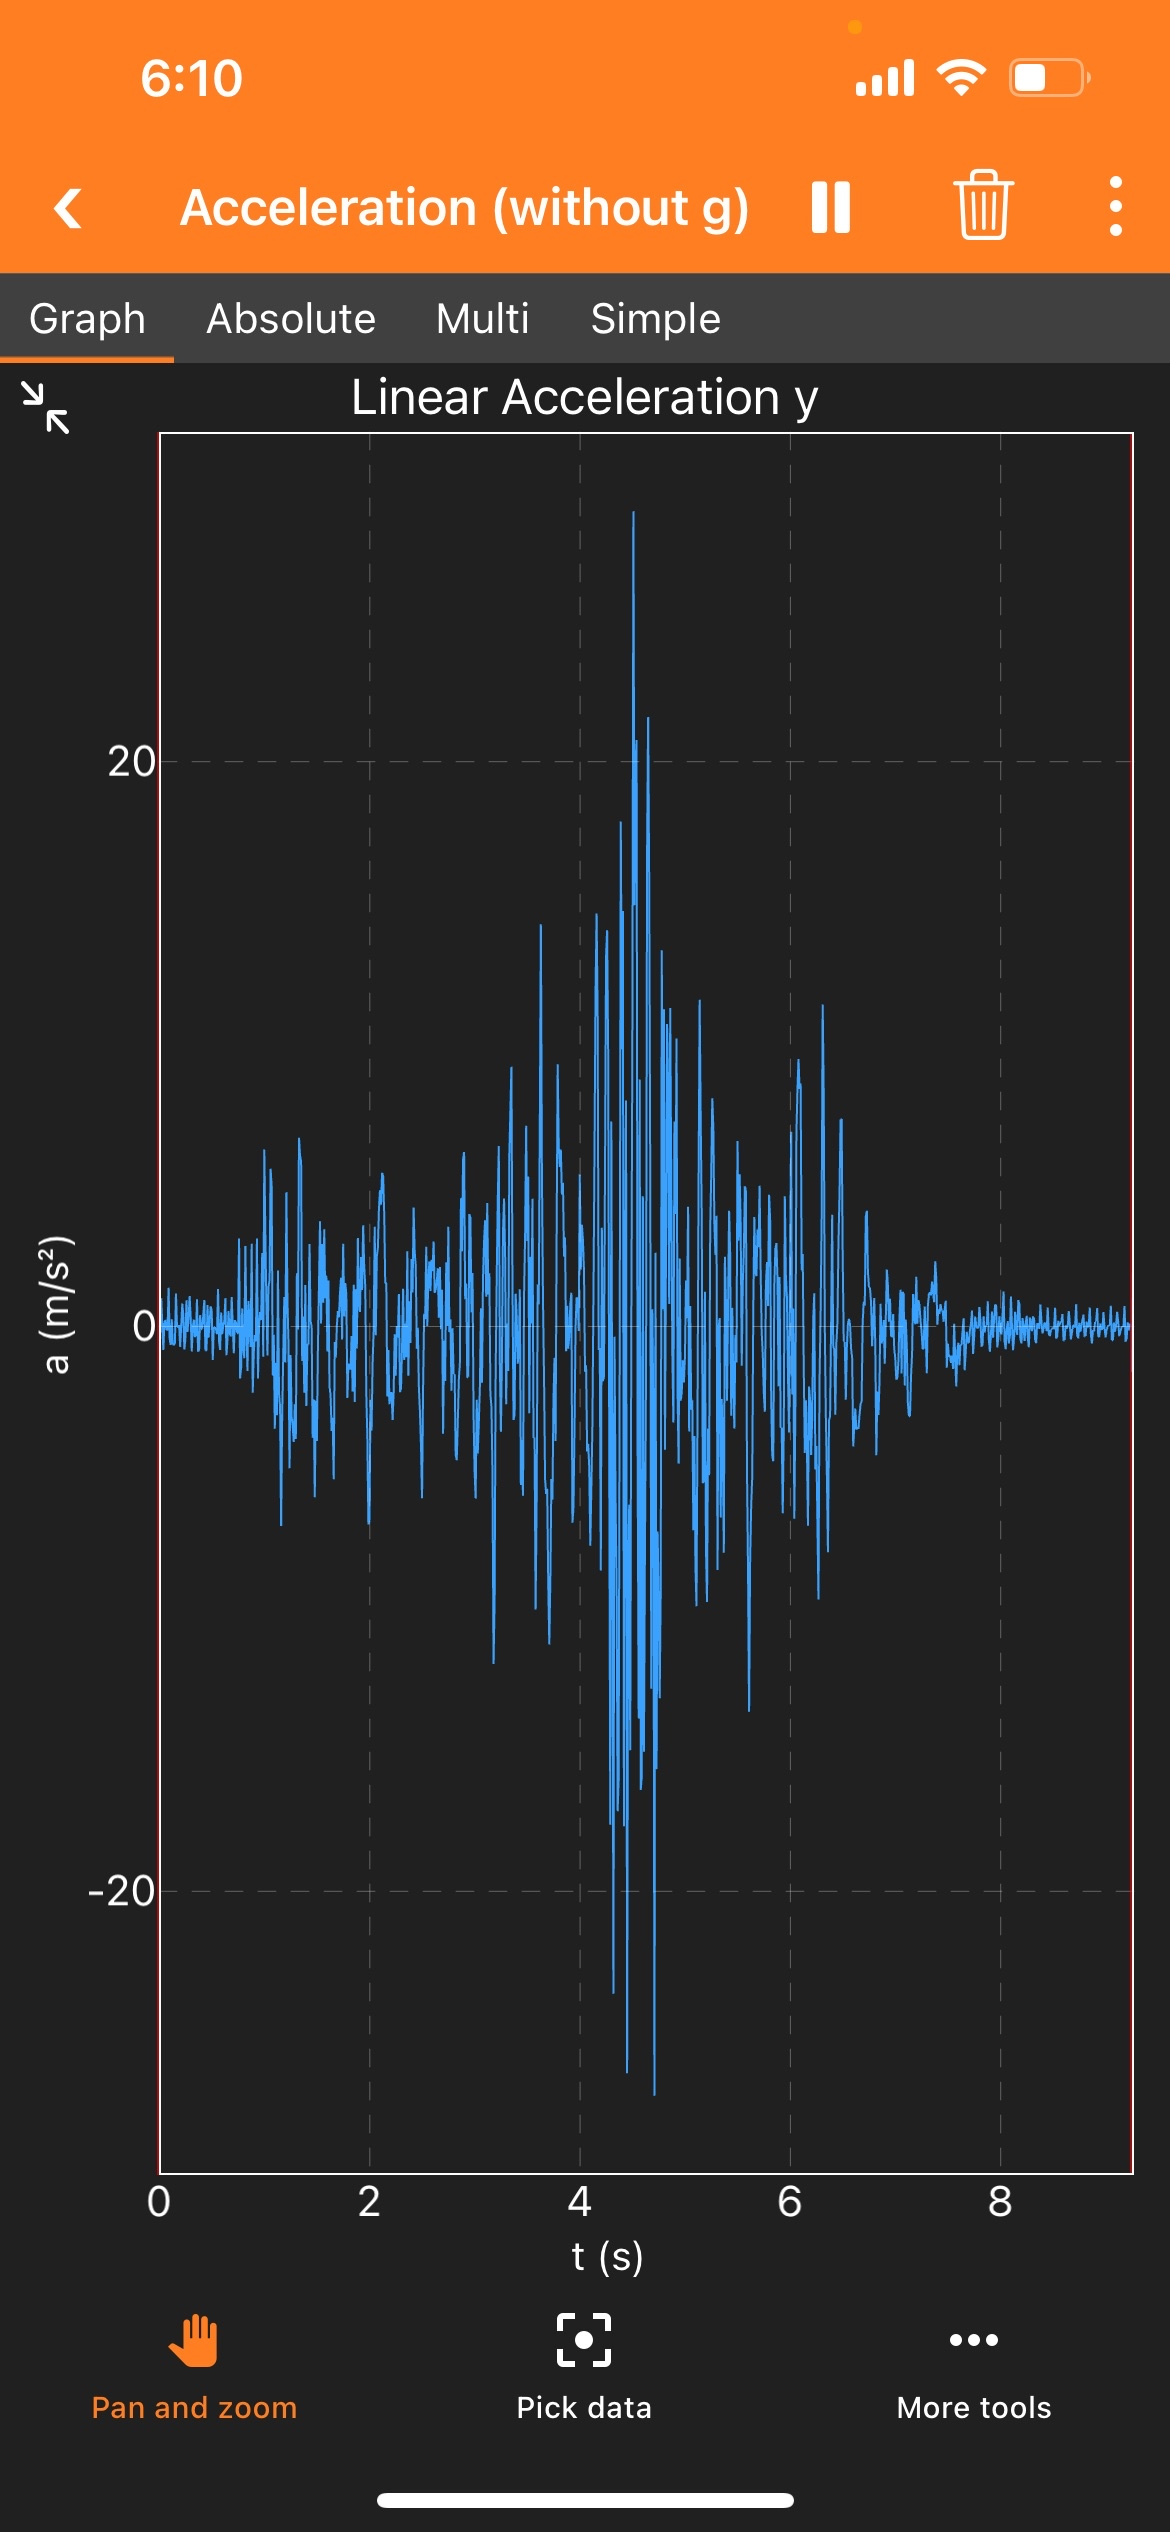
Real world testing was performed by creating rumbel strips comrised of 2x4 planks of wood spaced 1m apart, photogates spaced 1m apart were used to calculate the entrance velocity in m/s of the vehicles as it enters the strips. Utilizing accelerometers built into our phones and an app called Phyphox to record and store acceleration data. The phone was mounted in line with the front driver wheel to acheive the most accurate data.
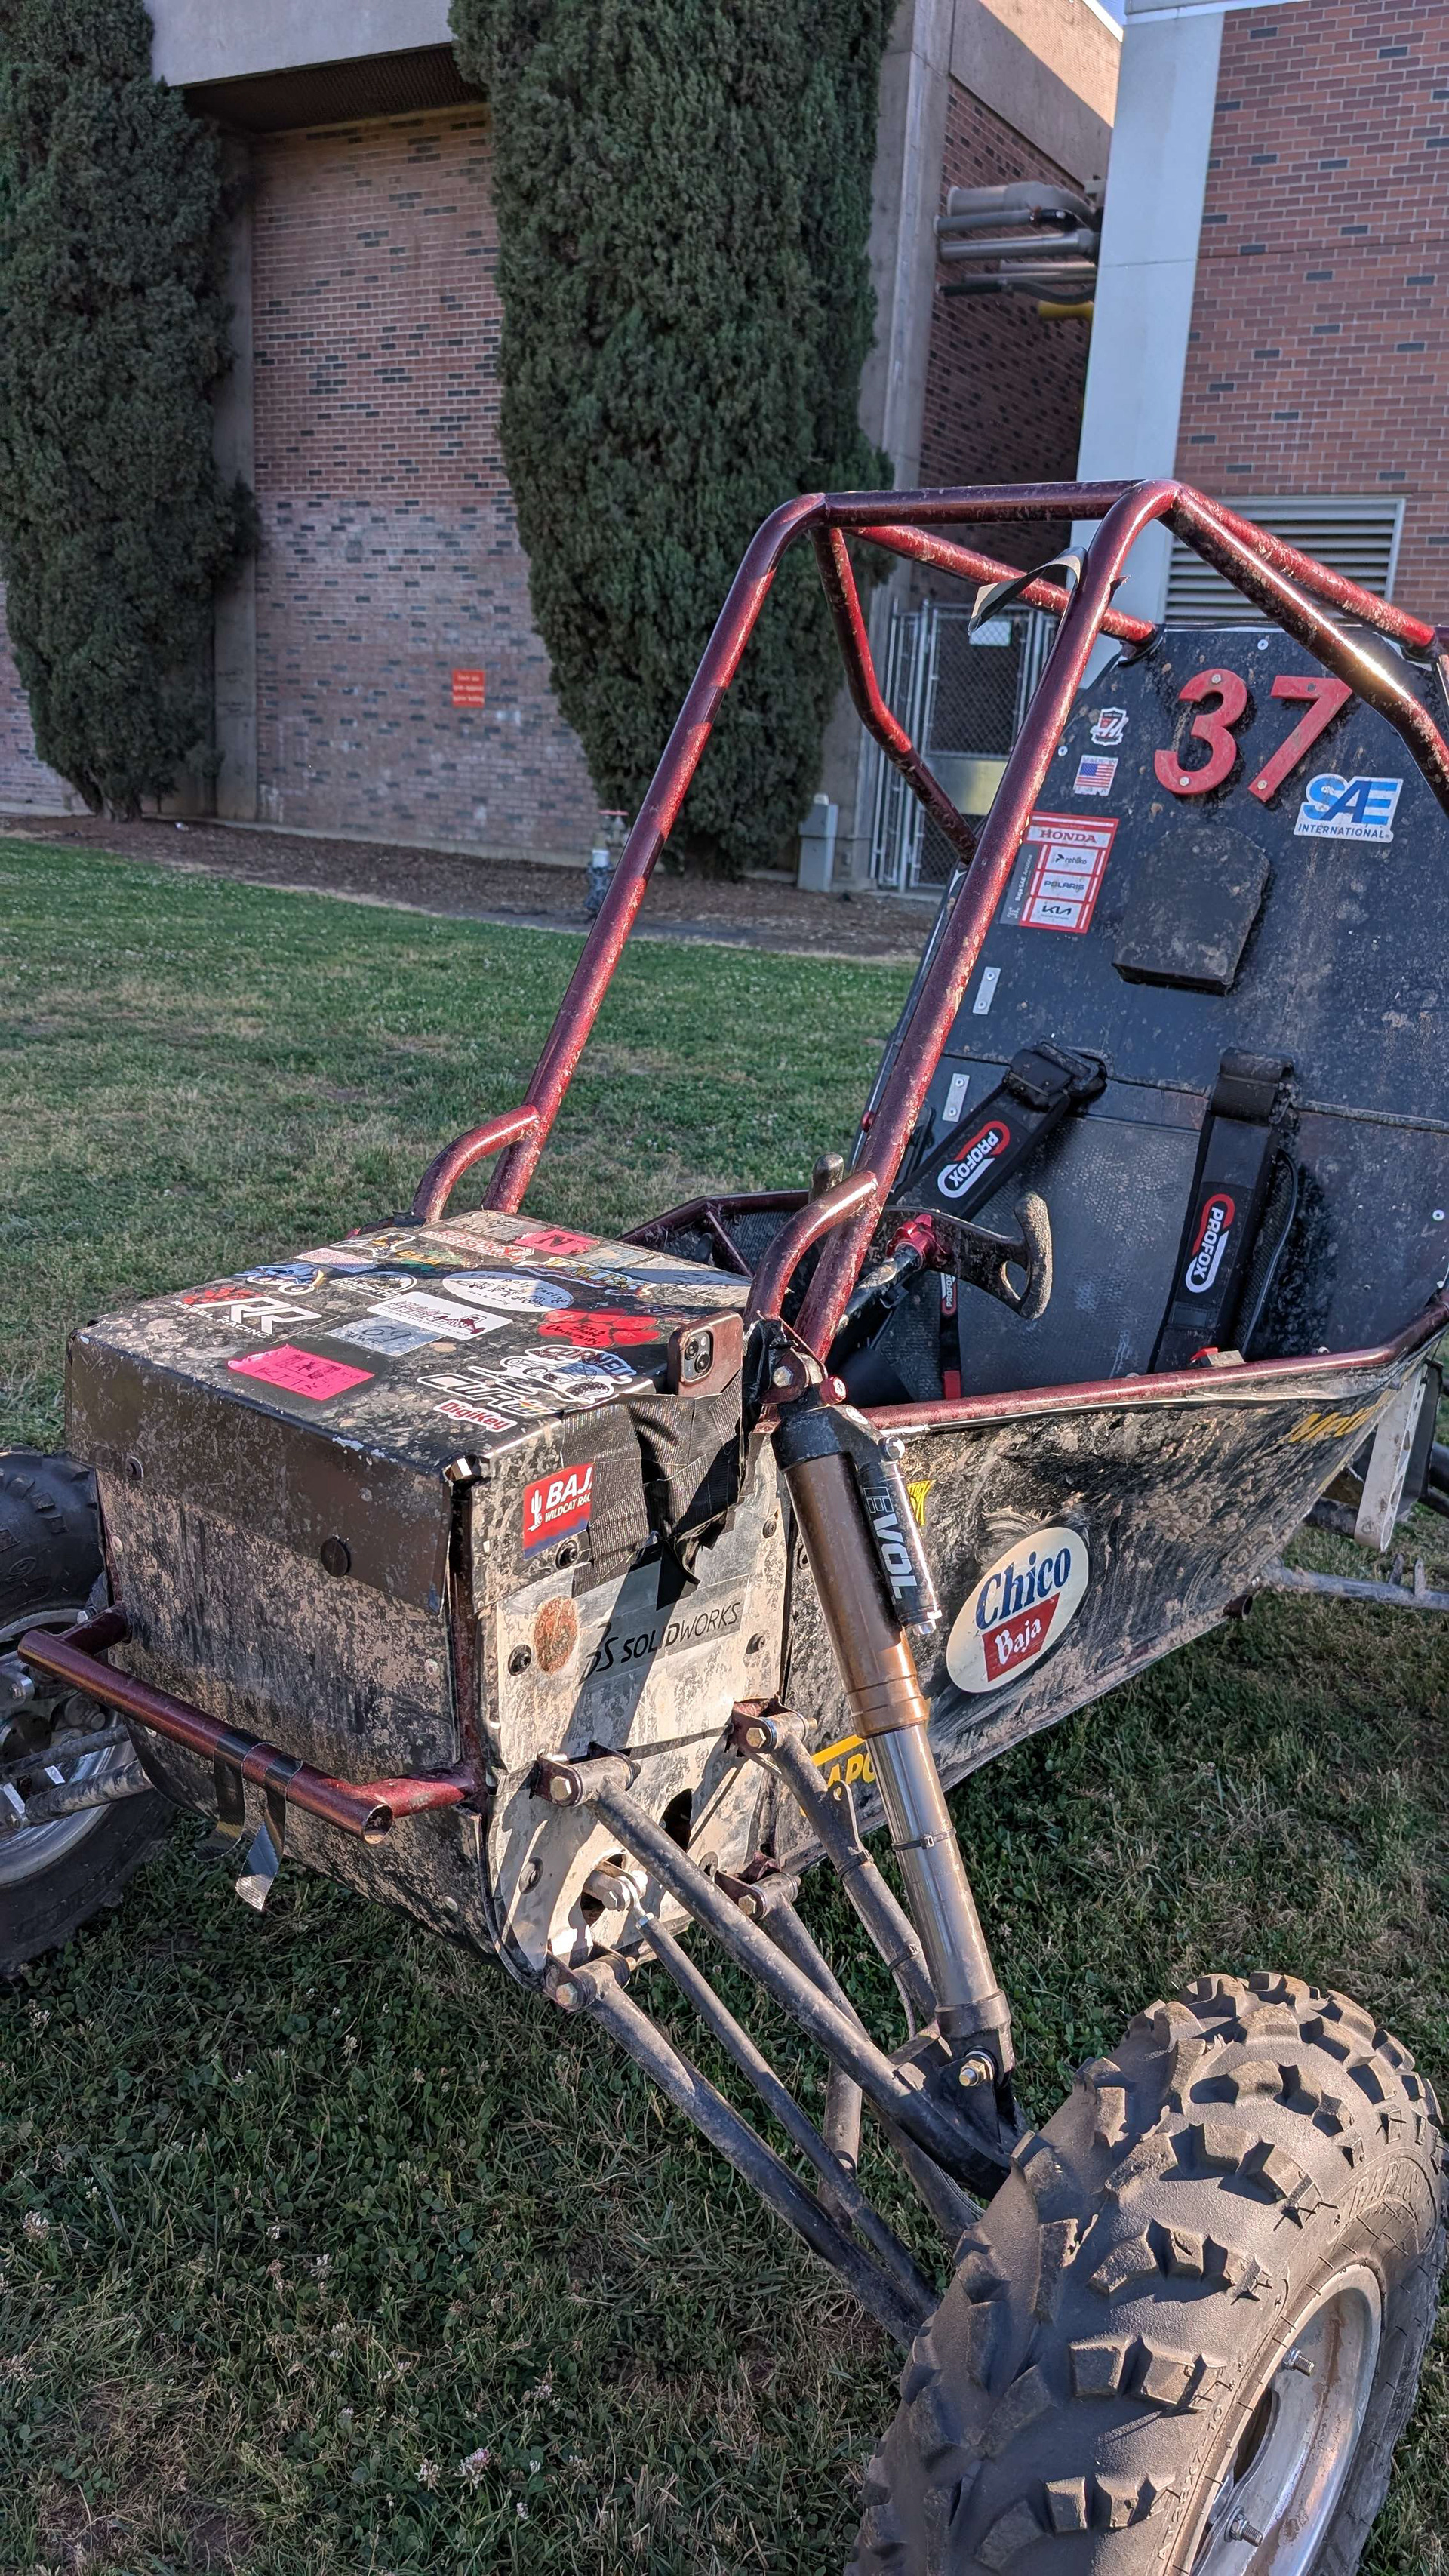
Three trials at both low and high speeds were conducted to collect sufficient data to create a reference model for comparison with the developing simulation model. The FOX EVOL suspension shocks were tuned to known spring and damper values so they could be implemented into the model. This allowed the simulation results to be compared with experimental test data in order to improve accuracy.
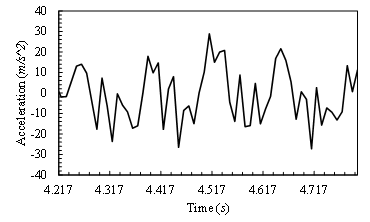
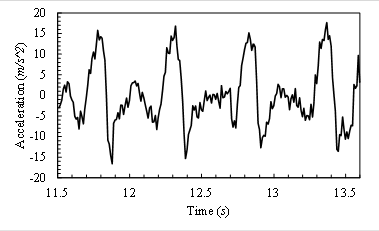
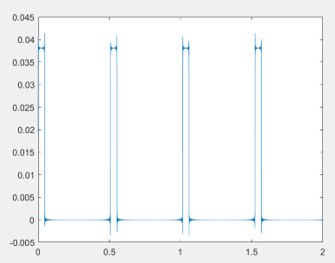
Utilizing the data collected a fourier series approximation wave can be created.
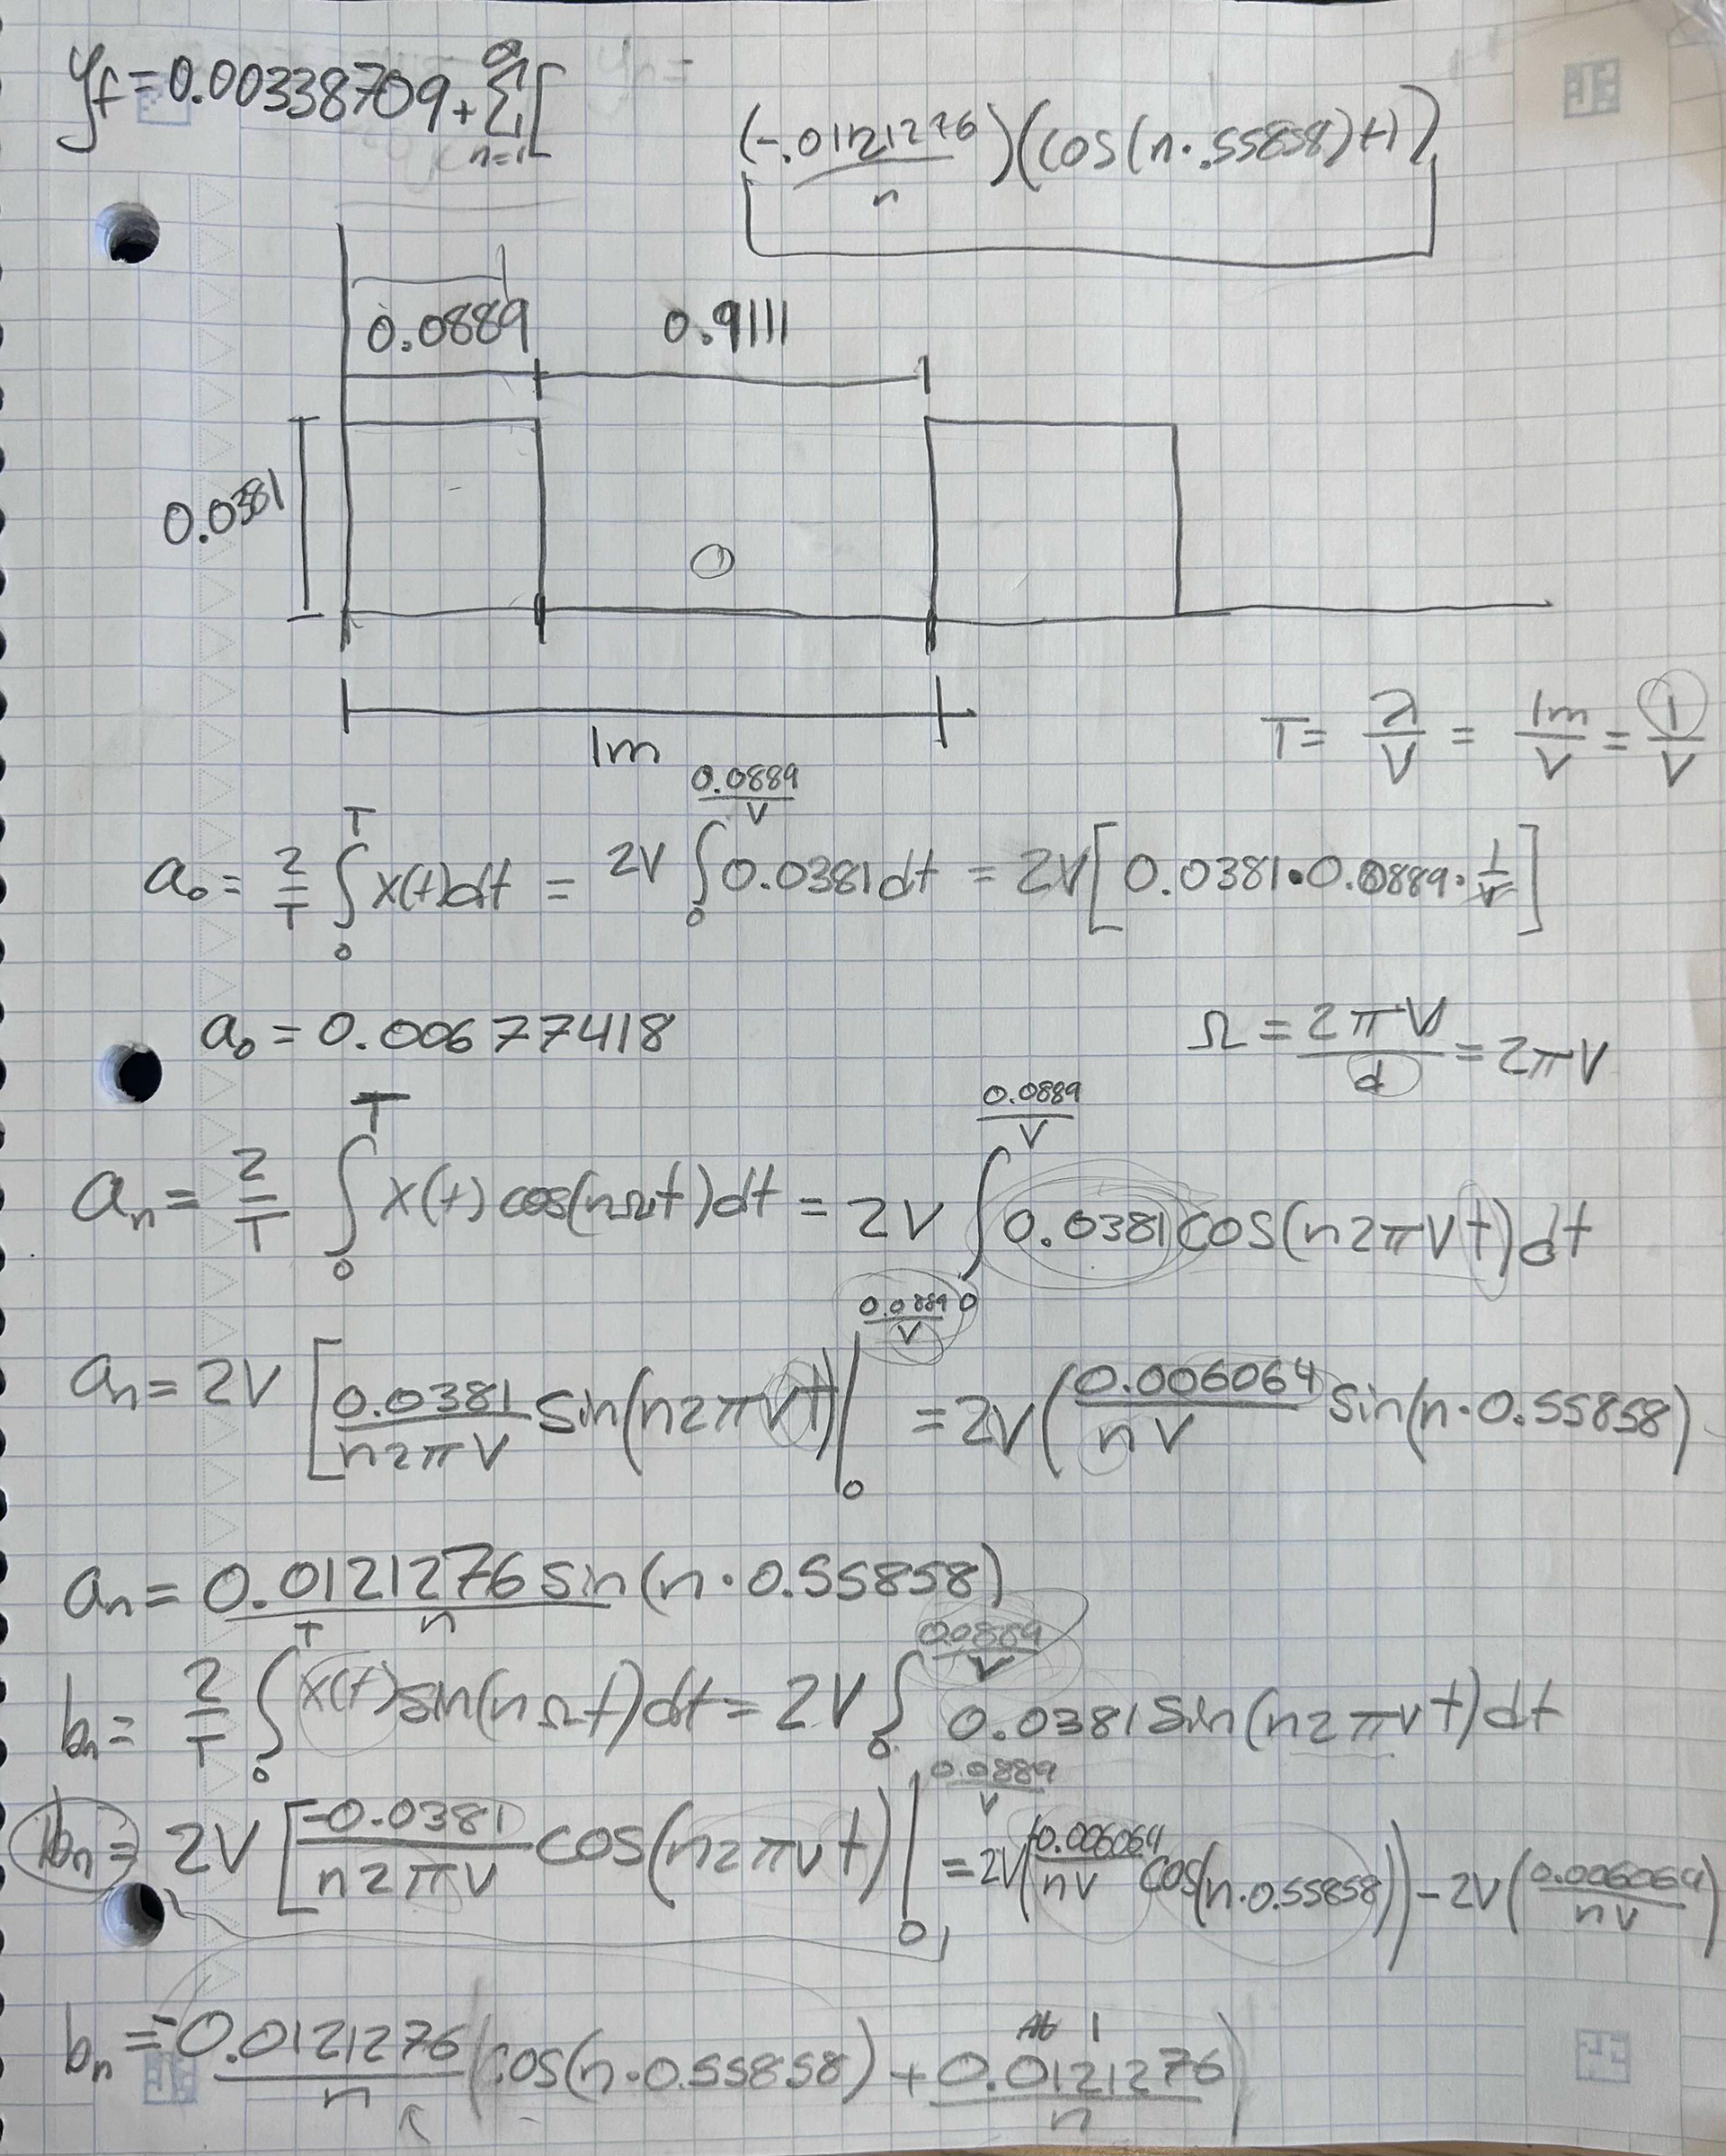


Following the engineering analysis, the half car model proved very beneficial, allowing for the formation of necessary equations to understand how the vehicle will react to the defined obstacle, in our case a repeating cycle of 2x4 square waves. The response data from experimental testing proved successful in both the low and high-speed trials. At lower speeds, the data collected visualizes a more distinguishable characteristic of what reliable vertical acceleration responses should be. This correlation helps validate the reliability of the testing method and the data itself. Overall, the method of testing proved sufficient but requires modifications and improvements to simulate more realistic styles of terrain a driver will be faced with at competition.